Table of Contents
Key Questions Answered
- What are the top brands in a market and category?
- What top brand has grown the most over the past year?
- What is my brand's market share by retail and unit sales?
- I'm looking to expand my product assortment to new categories. What categories are mainly dominated by a few brands vs. categories with a more even split of shares?
Snapshot
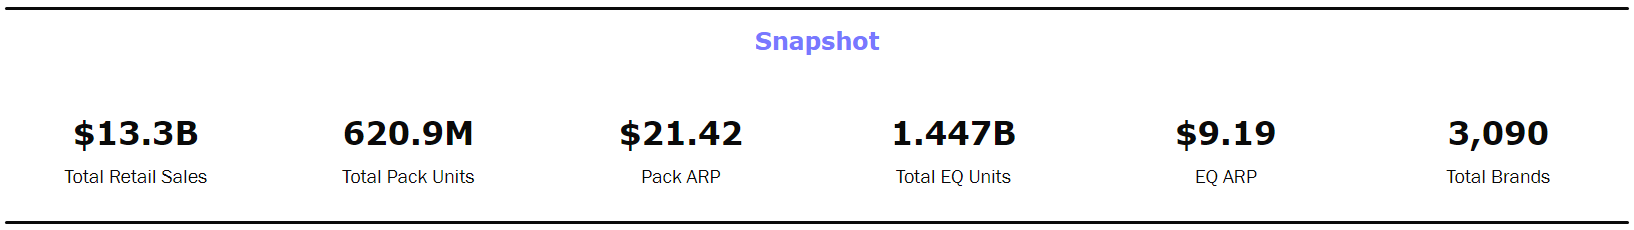
Get an overall snapshot of market KPIs. Utilize filters to get high-level insights into a market or category in a specific period.
Top Brands
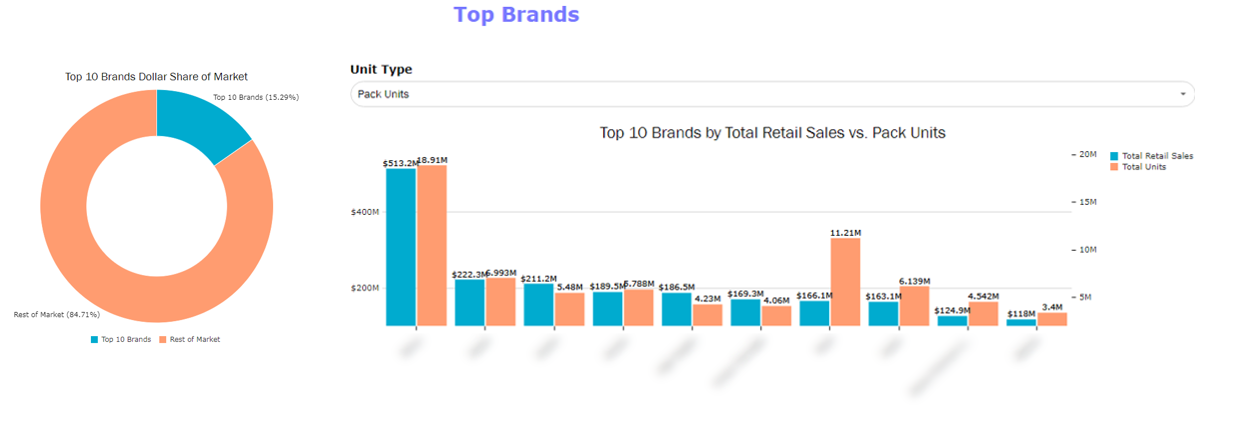
Evaluate who the top 10 brands are and what % of the market they account for.
- It can be utilized to understand how dominant some of the big brands are in a market or category.
- Can be utilized especially with the category filters to understand barrier to entry in a category or specific attribute.
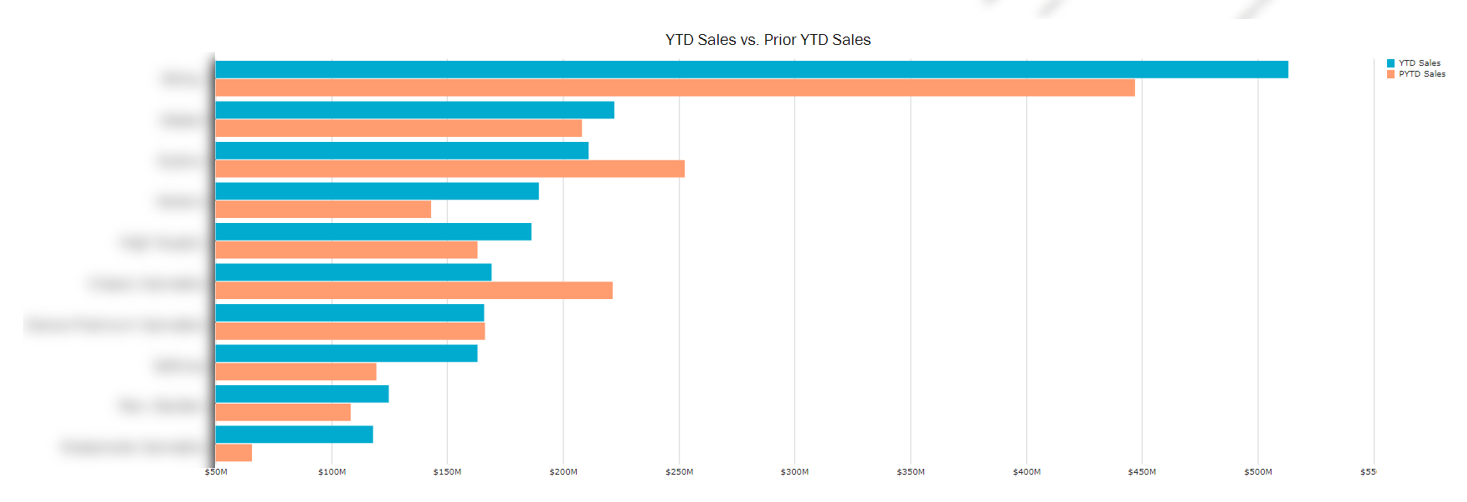
Evaluate YTD retail sales for the top 10 brands compared to where retail sales were the previous YTD.
Note that this always shows the most recent YTD and is not impacted by the date filter.
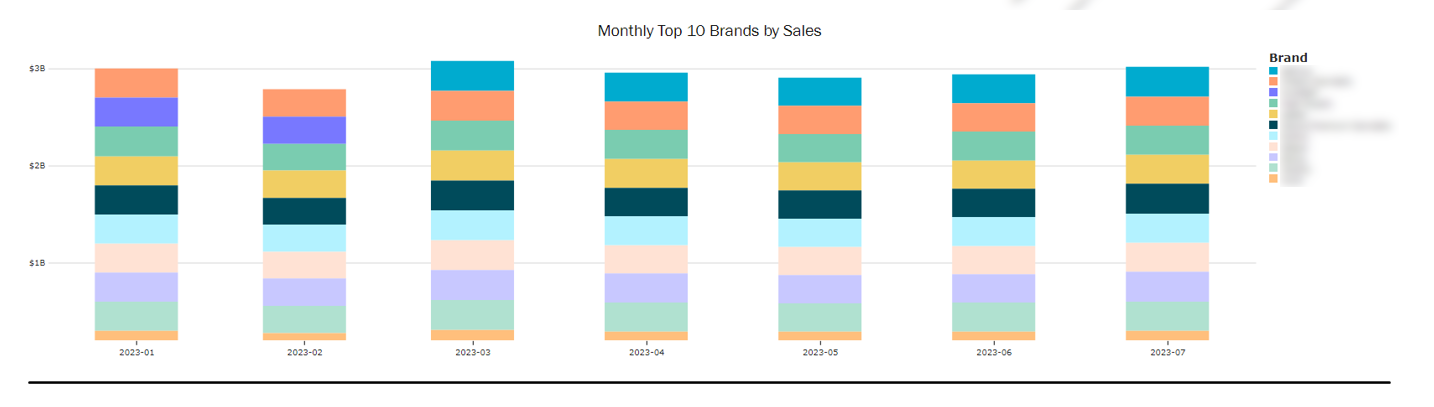
View the top 10 brands by retail sales by month to see how the top brands evolve and shift over time.
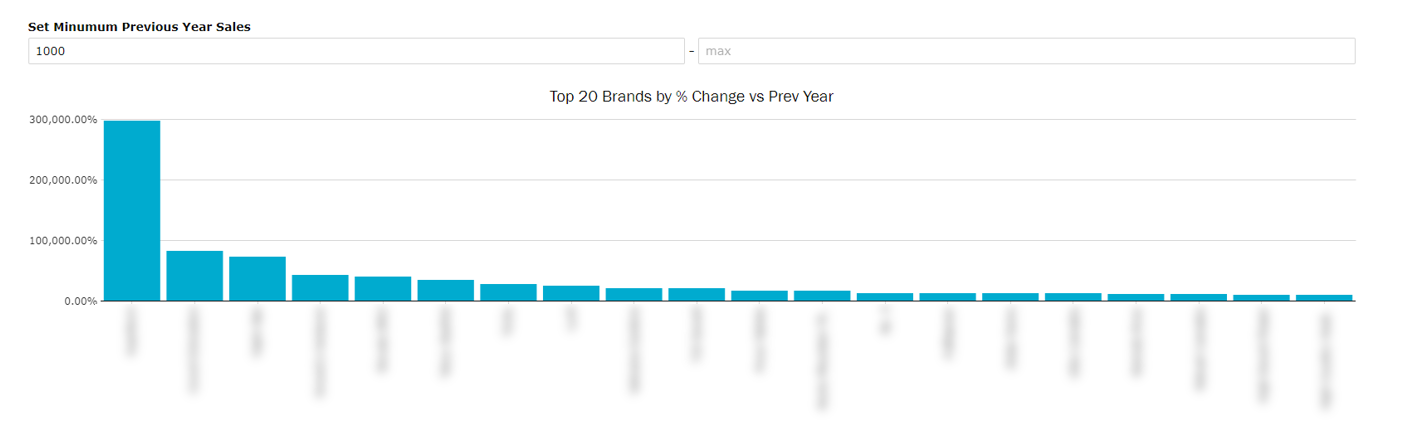
Rank brands by growth vs previous year rather than top total sales to track up and coming brands.
- Comparison is the same time period for the previous year.
- Ex: selecting January - March 2023 in the date filter will compare to January - March 2022
- Hover over any of the bars to see current period and same period previous year total sales

- Use the "Set Minimum Previous Year Sales" toggle to only see brands that fit a certain sales volume the year before what is selected in the date filter.
- Ex: only wanting to see top brand growth among well established brands by setting the previous year minimum to a higher number than if doing an analysis on newer brands by setting it lower.
- Default is 1000 to avoid overinflated % change for very small previous year brand sales
Tops Brands Extracts
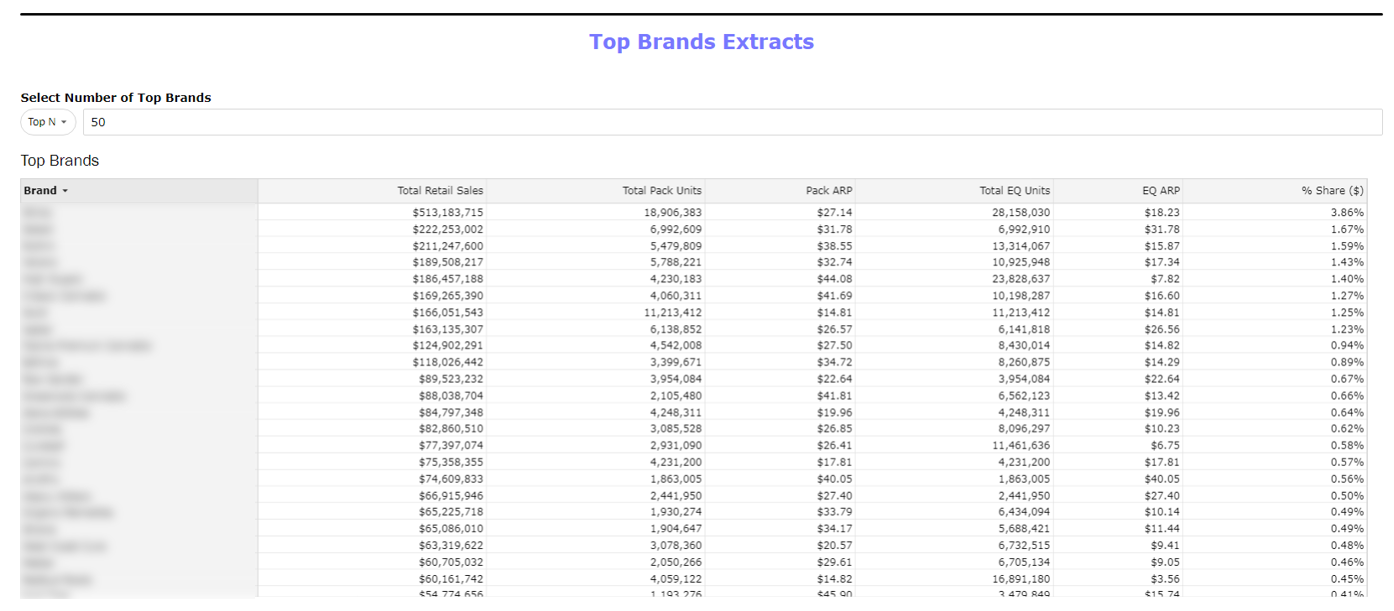
Track main KPIs among the top N selected brands
- Use the added filter for customizable brand rankings (Top N, Bottom N, Top Percentile, or Bottom Percentile).
- Top 50 brands by default
Note: we do not recommend selecting over 100 brands as this can cause long load times. For more detailed information of all brands, please use the Custom Extracts dashboard