Table of Contents
Snapshot
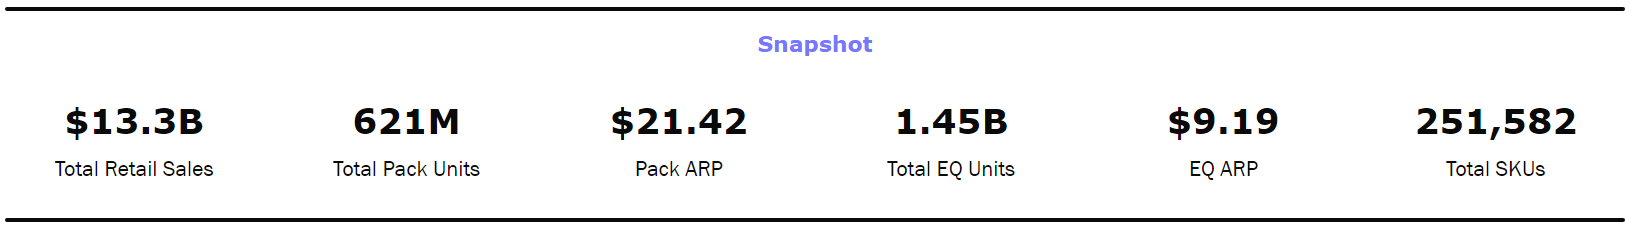
Get an overall snapshot of market KPIs. Utilize filters to get high-level insights into a market or category in a specific period.
Top Products
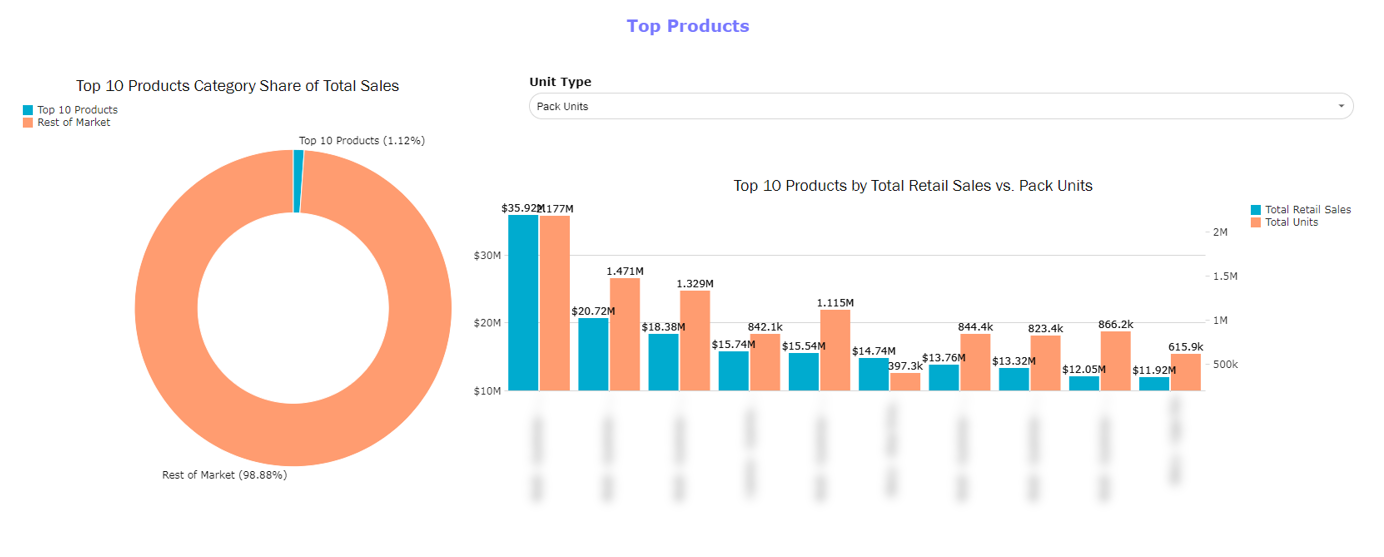
Evaluate the top 10 products based on total retail sales and their share of the market.
- Compare sales volume to EQ and pack units using the Unit Type selectors.
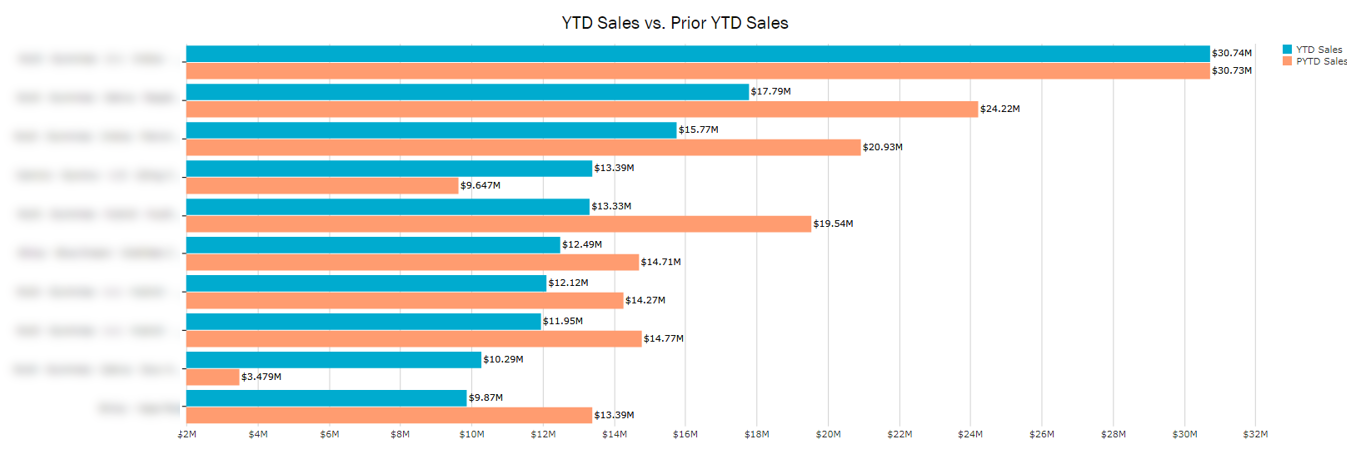
Compare YTD retail sales for the top 10 products of the current year to the total retail sales for the previous year.
Note that this will always show the current YTD and not change based on the date filter.
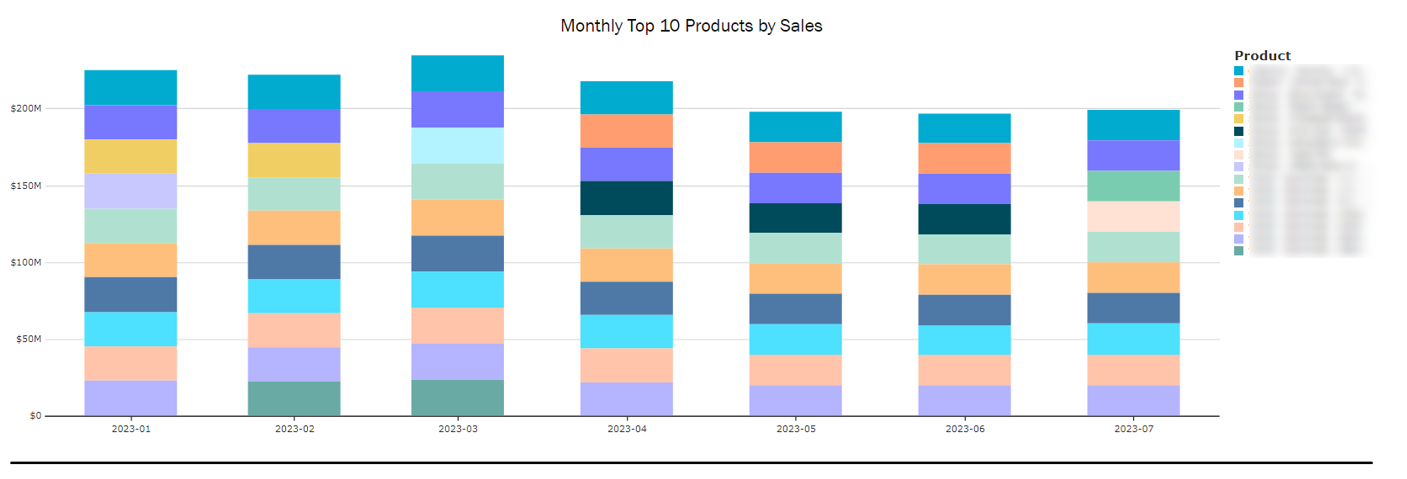
View the top 10 products by retail sales by month to see how the top products evolve and shift over time.
Top Products Extracts
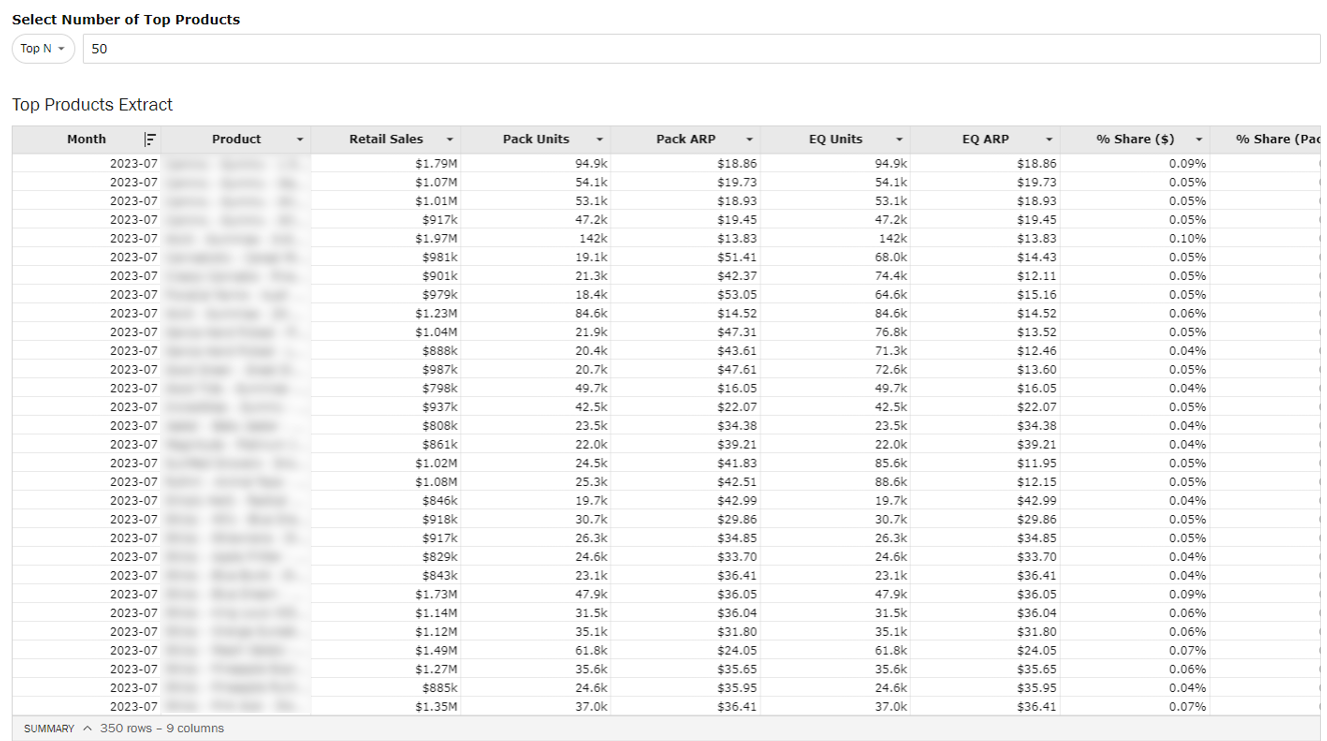
Track main KPIs among the top N selected brands (ranked by retail sales)
- Use the added filter for customizable product rankings (Top N, Bottom N, Top Percentile, or Bottom Percentile).
- Top 50 products by default
Note: we do not recommend selecting over 100 products as this can cause long load times. For more detailed information of all products, please use the Custom Extracts dashboard