Table Of Contents
Brand - Category Level Cross Analysis
Key Questions Answered
- Are my products selling more with other products in my portfolio or with other brands?
- I'm looking for acquisition opportunities. What brands are commonly bought with mine?
- I'm looking for possible category expansion. What categories of other brands are frequently bought with my products that I should look at expanding into?
- I'm looking to run a promotion on a certain brand. Are there category combinations that consumers typically gravitate toward?
- Are there common brands and products selling together that I should stock in my store?
Metric Dictionary
- Focus Category/Brand/Product
- Your brand or the brand you want to see interactions with.
- Added Category/Brand/Product
- All other brands and/or categories.
- % of All Transactions
- the percent of all transactions, with or without the focus brand/category, where those two items or type of items were purchased together
- % of Focus Category/Brand/Product Transactions
- Percent of Focus Brand/Category Transactions is the percent of all focus category/brand/product transactions where the added item is in that basket.
- Ex: the focus category, flower, is bought 500 times. Of those 500 times, it's bought with a pre-roll 250 times, so the % of focus category for pre-roll is 50% because pre-rolls are in flower transactions 50% of the time that flower is purchased
- Note that this does not work inversely! We cannot conclude that flower is in 50% of pre-roll transactions because it's a different base of transactions. Pre-rolls may be bought 300 times total, so those same 250 pre-roll/flower transactions will actually account for 83% of pre-roll transactions.
- Lift
-
A measure of the strength of the relationship between the focus and other item. Measures how many more times the focus and other item appear in the same order, compared to if there was no relationship between them. Calculated by taking the % of focus category/brand/product and dividing it by the % of time out of all transactions that the added item is purchased.
-
Lift = 1; implies no relationship between the focus and other item (i.e., they occur together only by chance)
-
Lift > 1; implies that there is a positive relationship between the focus and other item (i.e., they occur together more often than random)
-
Lift < 1; implies that there is a negative relationship between the focus and other item (i.e., they occur together less often than random)
-
- Ex: Vapes are in 22% of edibles purchases, which without lift would indicate that there's a strong chance someone will buy a vape if they're also buying edibles. Lift takes a look at the % of time vapes are purchased in general (with or without another item) and compares to vapes being purchased in edibles. If vapes are purchased 25% of the time, then lift would be .88, meaning consumers are actually less likely to purchase a vape in an edibles transaction than purchasing in general.
-
Filter Panel
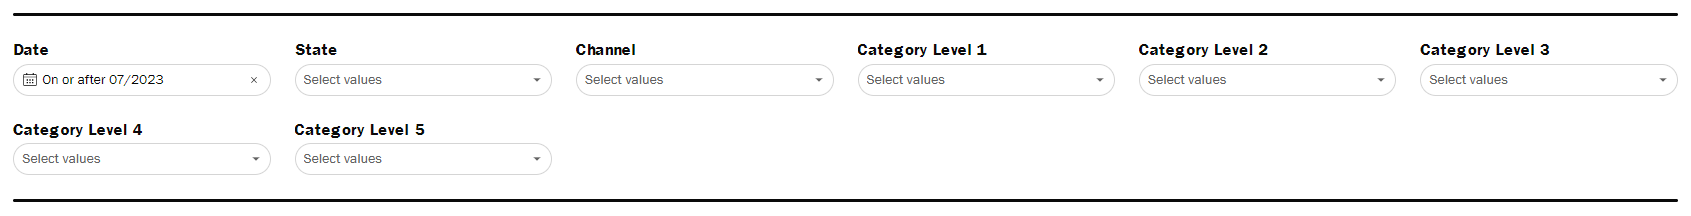
Top filter panel will filter the added category/brand/product for all cross tables.
Category Level Cross Analysis
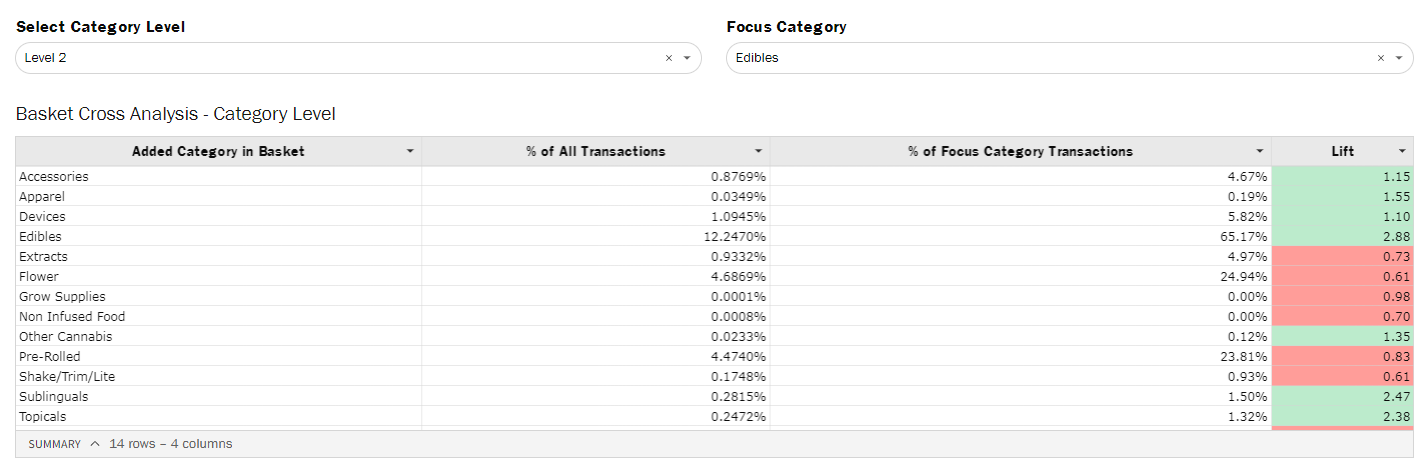
Use the category level overview as a benchmark to understand the most common category combinations.
Brand - Category Level Cross Analysis
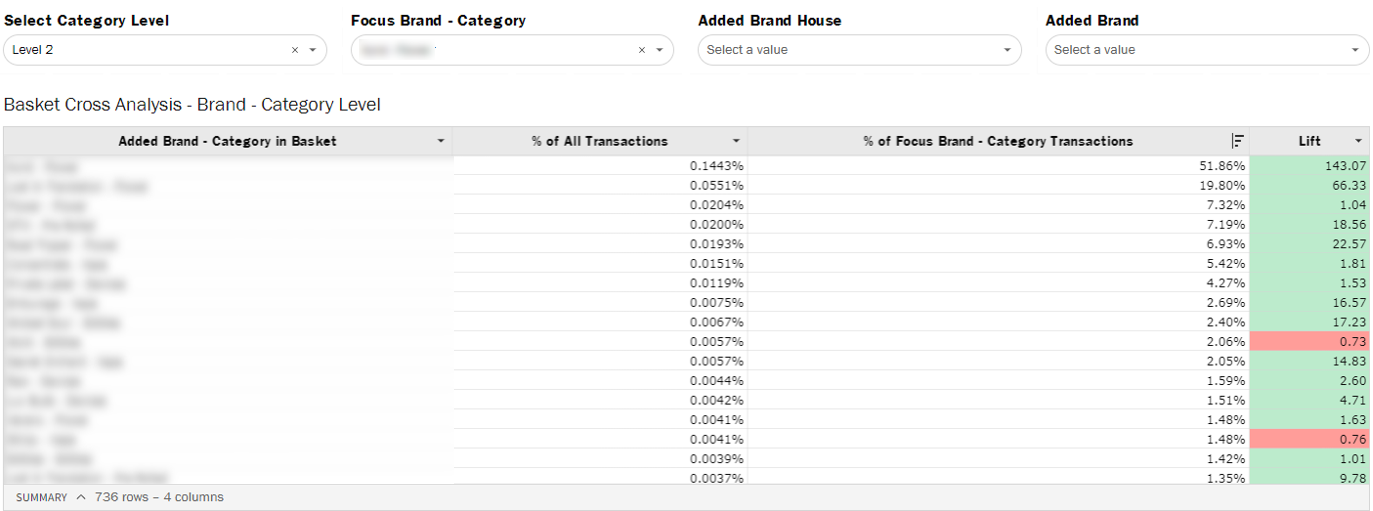
The Brand - Category Level table tracks the % of your focus brand/category’s transactions that are bought with the same or other brand/categories.
- The filters within the section will only apply to that table, so it's easy to target a specific brand or category of interest to see the interaction with the focus brand using the Added Brand House and Added Brand filters.
- Ex: I'm looking to expand my brand's product offerings but I don't want to cannibalize sales from another brand in my brand house. Using the brand house filter, I can filter results to only my brand so I can see if there's any opportunity to expand my brand out or if there's already strong correlation between brands in my brand house with that category.
Product Level Cross Analysis
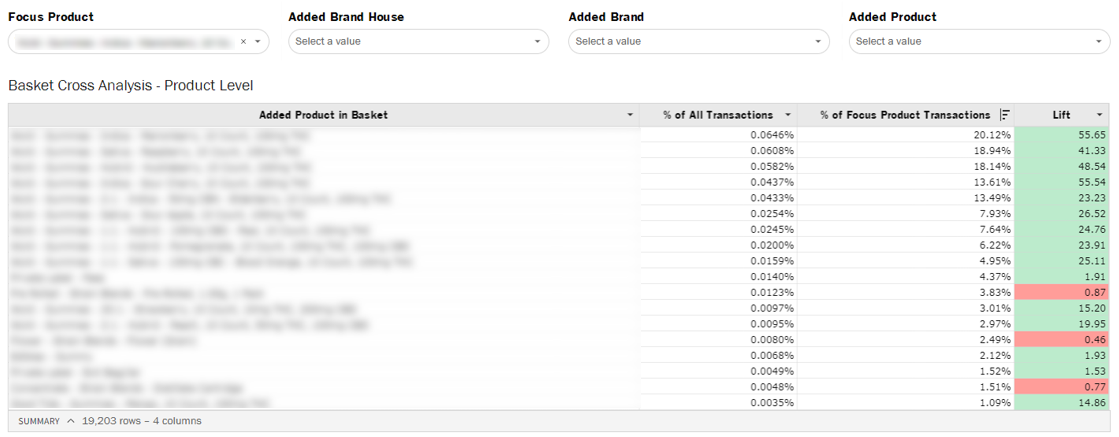
The Product Level table tracks the % of a focus product’s transactions that are bought with the same or other products.
- The filters within the section will only apply to that table, so it's easy to target a specific brand or product of interest to see the interaction with the focus product using the Added Brand House, Added Brand, and Added Product filters filters.
- Ex: I'm looking to optimize the assortment of my 100mg THC gummy products, so I want to know which of my products is going to drive cross purchase with my brand more vs ones more likely to be cross purchased with another brand's products. This can also provide insight into the attributes of other products regularly purchased with mine, driving potential innovation to bring those attributes into my portfolio.