Table Of Contents
Key Questions Answered
- How is basket performance impacted by behavior changes due to the seasons?
- How does the relationship between total sales and ARP change over the course of a week?
- I need to start demand planning for an upcoming holiday. How many incremental sales can I expect from a specific holiday?
- What kind of discounting can be expected from retailers and are those discounts resulting in enough incremental sales to offset the lower price?
- What categories perform the best on specific holidays?
Holidays Included
- New Years Day
- Martin Luther King Jr Day
- Valentines Day
- St. Patrick's Day
- "4/20"
- Mothers Day
- Memorial Day
- Fathers Day
- Independence Day
- Dab Day (7/10)
- Labor Day
- Halloween
- Veterans Day
- Green Wednesday
- Thanksgiving Day
- Black Friday
- Christmas Day
Holidays KPIs

Use the top panel of KPIs to evaluate how price and basket dynamics change based on if it is a holiday week or not. Use the filters to get a quick snapshot of these KPIs for markets, categories, or brands.
- Holiday weeks are defined as the 6 days leading up to a holiday plus the day of the actual holiday.
- What is an “incremental basket”?
- Incrementality is a method used to track how many extra transactions were sold due to it being the week of a holiday. It is used by looking at the number of transactions happened on non-holiday weeks and seeing how many % more happened on holidays weeks.
- Calculated by measuring sales associated with holiday weeks compared to the average non-holiday week.
- The logic transfers to incremental items. It is the % more items in a basket on average compared to non-holiday weeks.
Day of Week
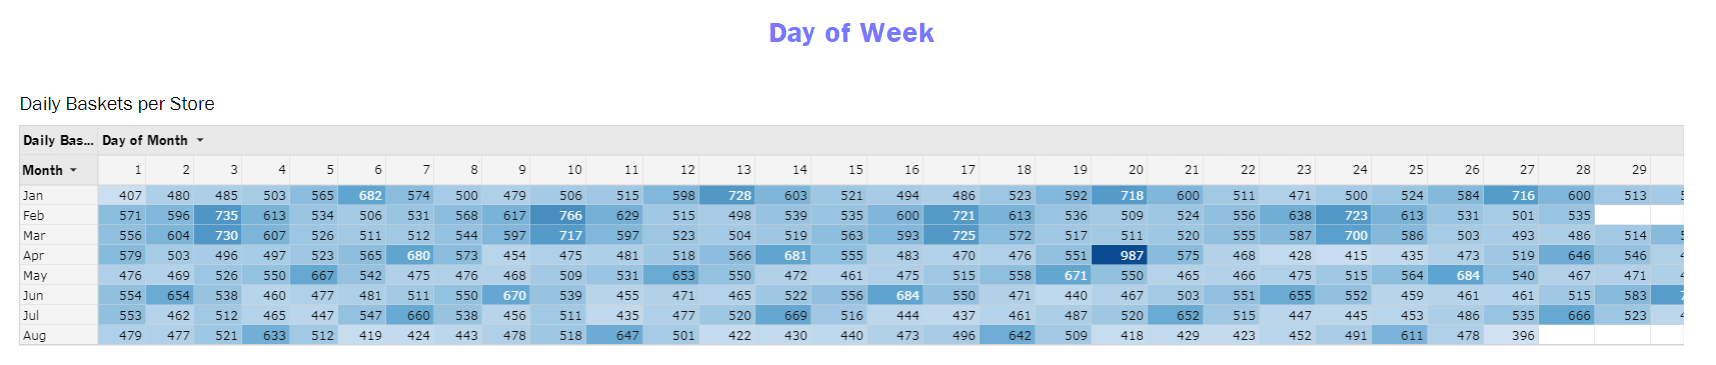
Use the top calendar widgets to track average number of baskets on a daily basis.
- Calendar widgets are colored lightest to darkest based on the metric used where the lightest square is the smallest value and the darkest square is the largest value relative to all others.
- Helps identify top selling days for a brand to compare to possible promotions that ran, new stock, brand launch, etc.
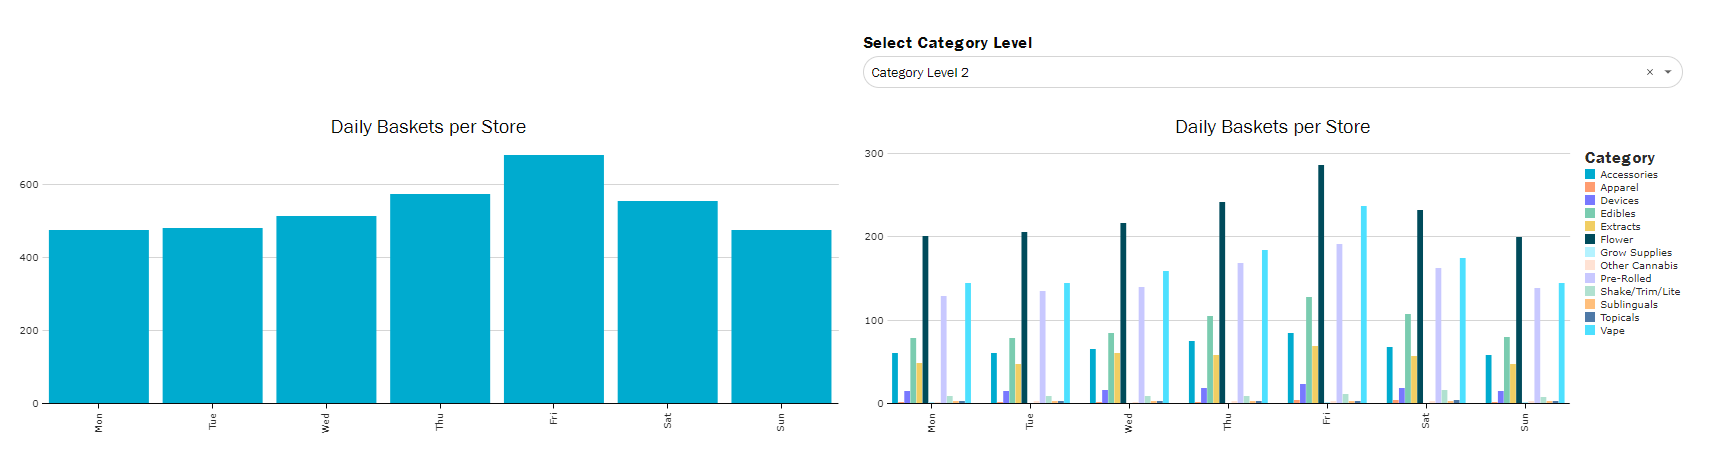
Track the total number of baskets by each day as well as the category makeup across days of the week.
- This can help indicate when it is best to promote or feature an item in a certain category.
- This is also helpful for demand planning when best to stock items in certain categories.
Seasons
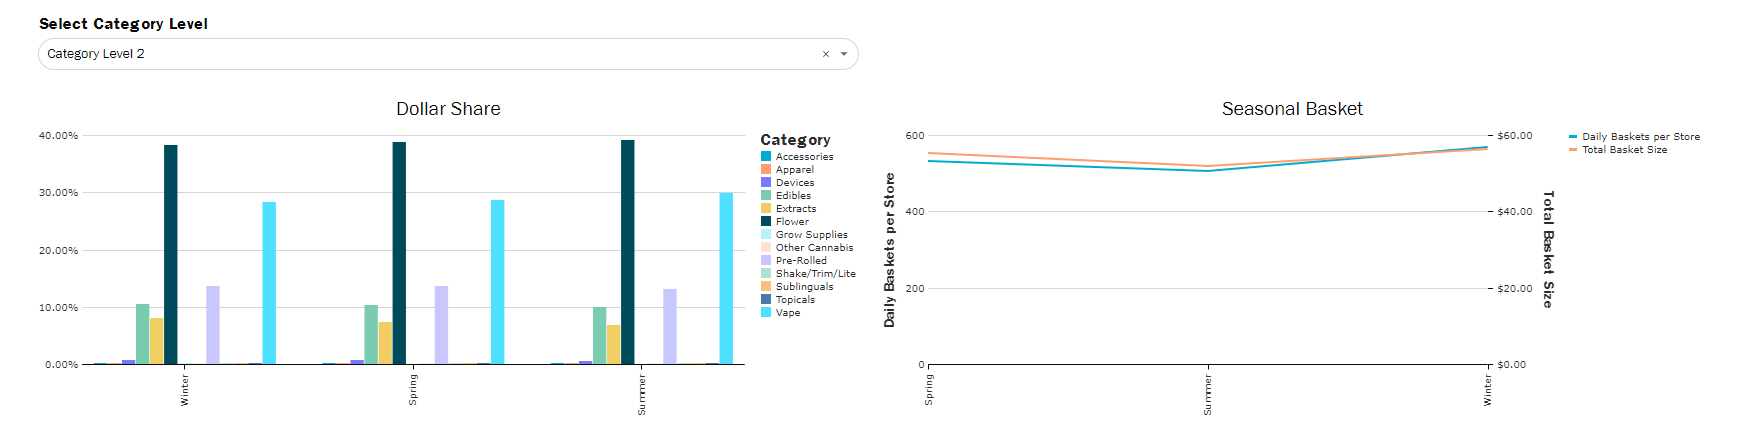
Follow which categories sell most across different seasons, as well as which season drives the highest number of transactions and amount spent.
- Seasons start and end are roughly determined by each seasons solstice and equinox dates. Normalized to exact dates for consistency across years.
- Winter: December 22nd-March 20th
- Spring: March 21st-June 21st
- Summer: June 22nd-September 23rd
- Fall: September 24th-December 21st
Holidays
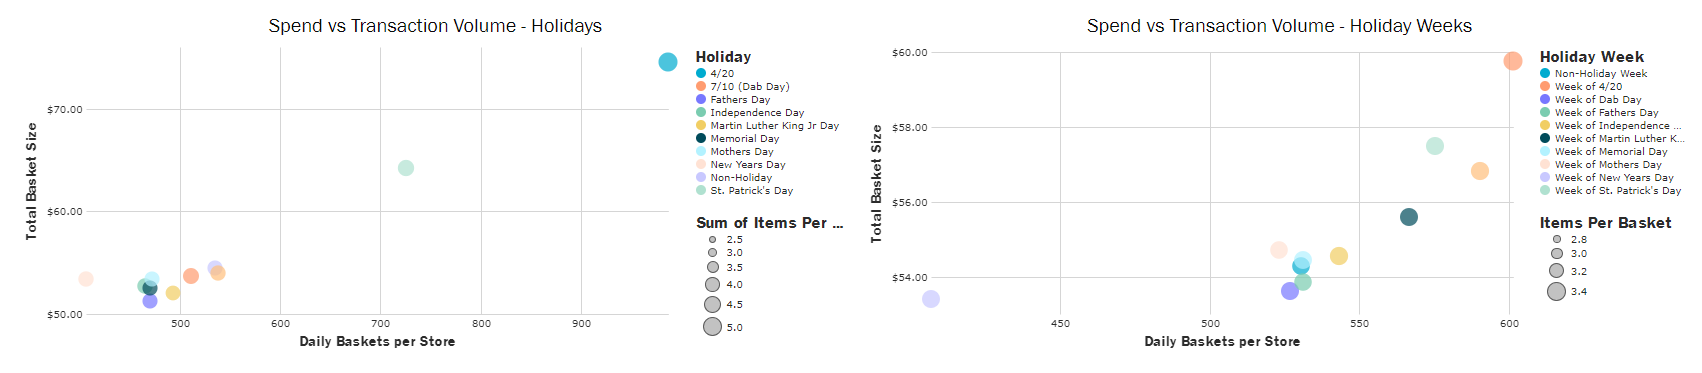
Use these scatterplots to track basket performance on holidays and holiday weeks vs non-holidays.
- Y-axis is basket size.
- X-axis is number of daily baskets per store.
- Dots are sized by number of items sold in a basket.
- Please note that number of items is an average number, so it will not always be a perfectly rounded number (ex: 2.9 items per basket).
- These scatter plots can help you prepare for increased volume that happens on holiday weeks, as well as using the category filters to see which categories are driving the most volume to prepare inventory and promotions.
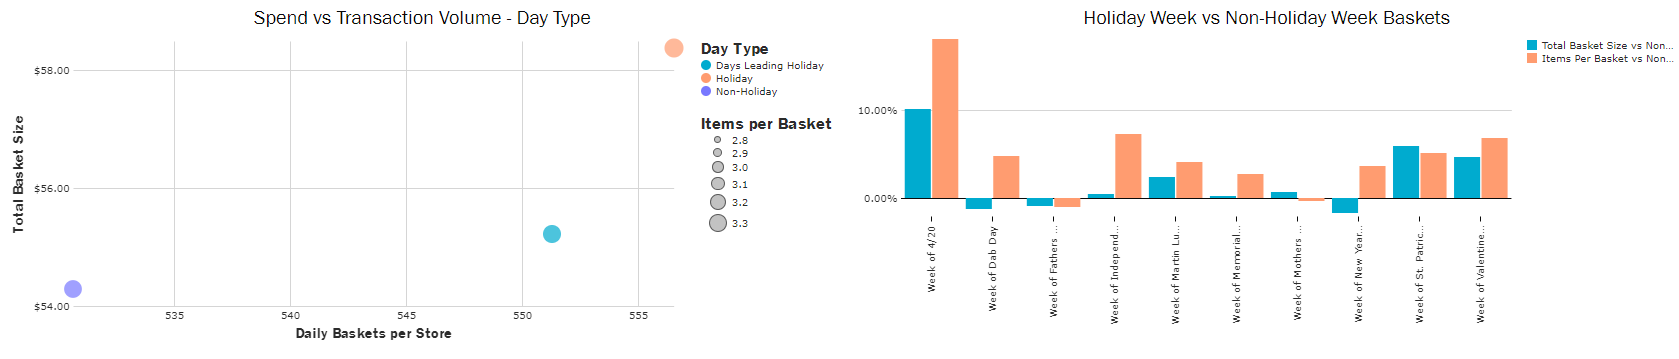
We can evaluate the same scatter plot grouped into holidays, days leading holiday, and non-holidays. These groupings can give you a sense overall what drives the most business.
- Y-axis is basket size.
- X-axis is number of daily baskets per store.
- Dots are sized by number of items sold in a basket.
- Please note that number of items is an average number, so it will not always be a perfectly rounded number (ex: 2.9 items per basket).
- “Holiday” is the actual holiday day.
- “Days Leading Holiday” are the 6 days leading up to a holiday.
- The one exception is “Dab Day” which only has 5 days leading because it overlaps with Independence Day.
- “Non-Holiday” is any day that is not a holiday or the 6 days before.
Holiday Week vs Non-Holiday Week Baskets evaluated the incremental Basket Size and Items per Basket
- Ex: on the week of 4/20, there basket sizes are 10% larger than a non-holiday week and there are 18% more items in each basket than a non-holiday week
- Use the category filter to drill in further what the average discount is for each category.
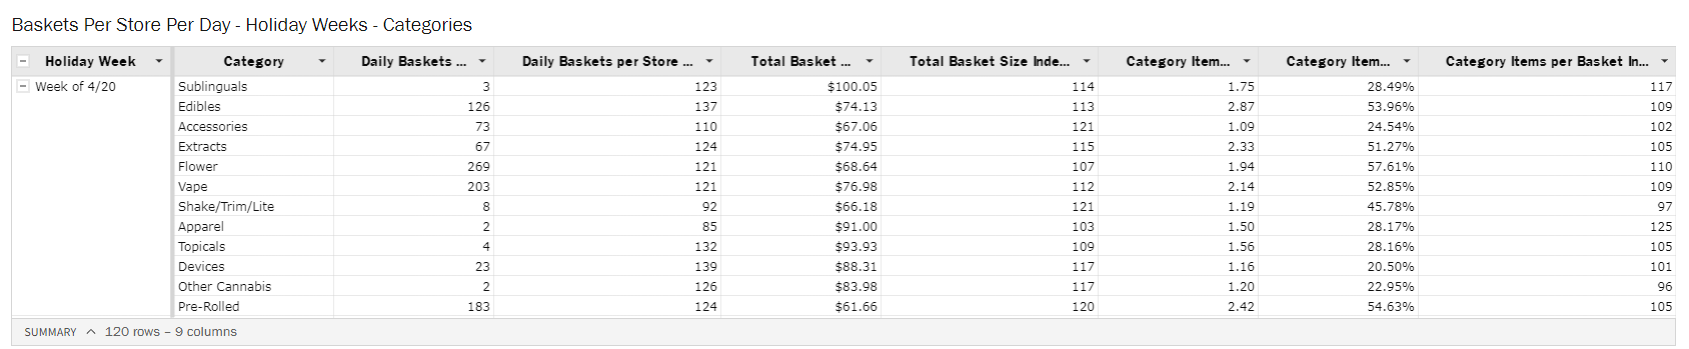
The final widget in this dashboard is a table that looks at each category selling that holiday week, basket size, daily baskets per store, and items per basket, and then compares them to non-holiday weeks using an index.
What is an index?
- An index represents the % above or below the metric you're comparing against.
- Ex: if basket size index is 105 compared to a non-holiday, then baskets sold during that holiday week are 5% larger than a non-holiday week. If your index is 95, then it’s 5% smaller. If your index is 100, it’s exactly the same as the average.
Use this table to evaluate which categories are driving the most transactions, most amount spent, and compare the amount discounted to the extra merchandise it sold.