Table Of Contents
Key Questions Answered
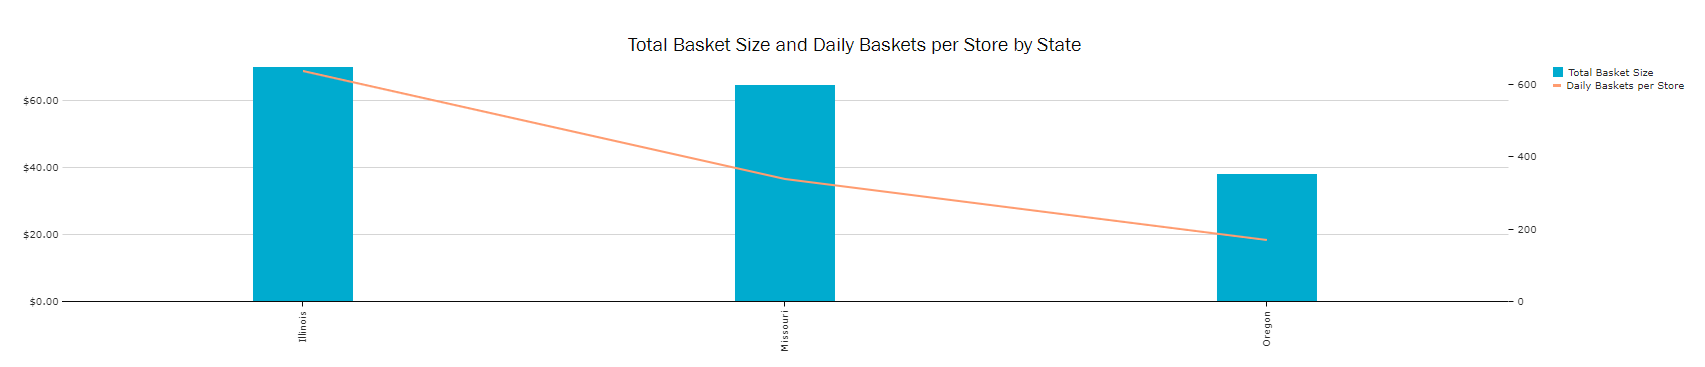
- For the average store in a market, what are the daily number of transactions taking place and how large are those transactions?
- Which categories produce the largest basket size?
- Which categories are bought most frequently?
- What is the relationship between ARP and basket size? Are prices driving a higher or lower average basket size?
State and Category Overview

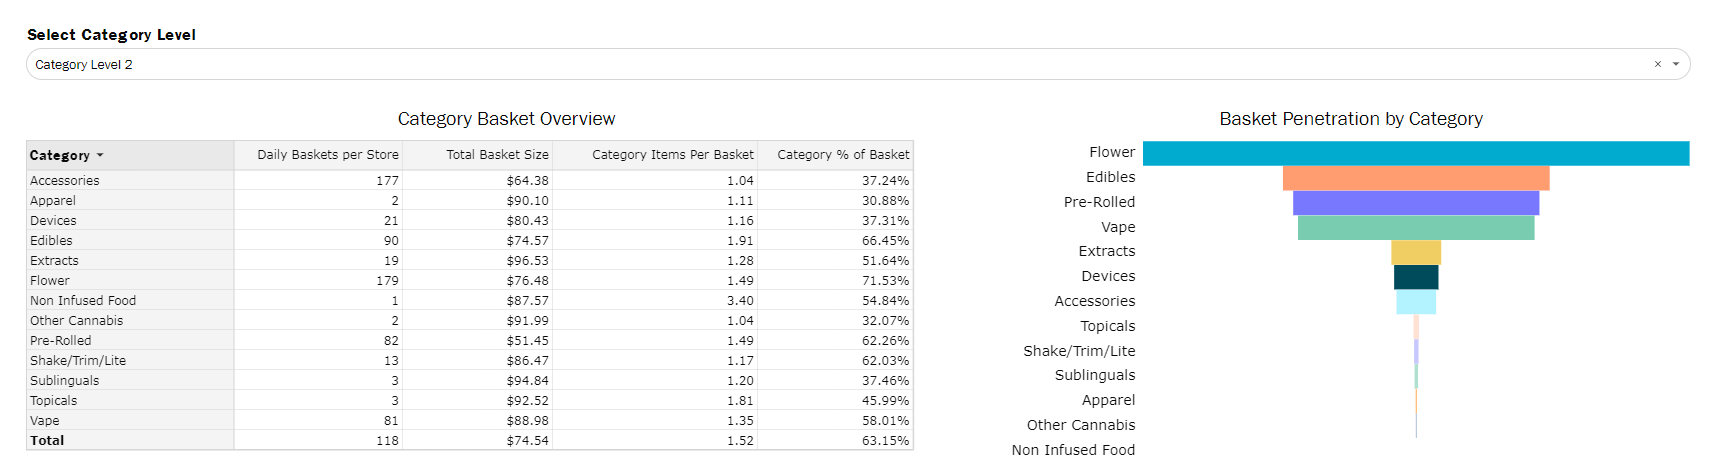
Use these widgets to track the total basket size, number of daily baskets, total and category items per basket, and basket penetration across available markets and the selected category level. This gives a baseline overview of basket performance.
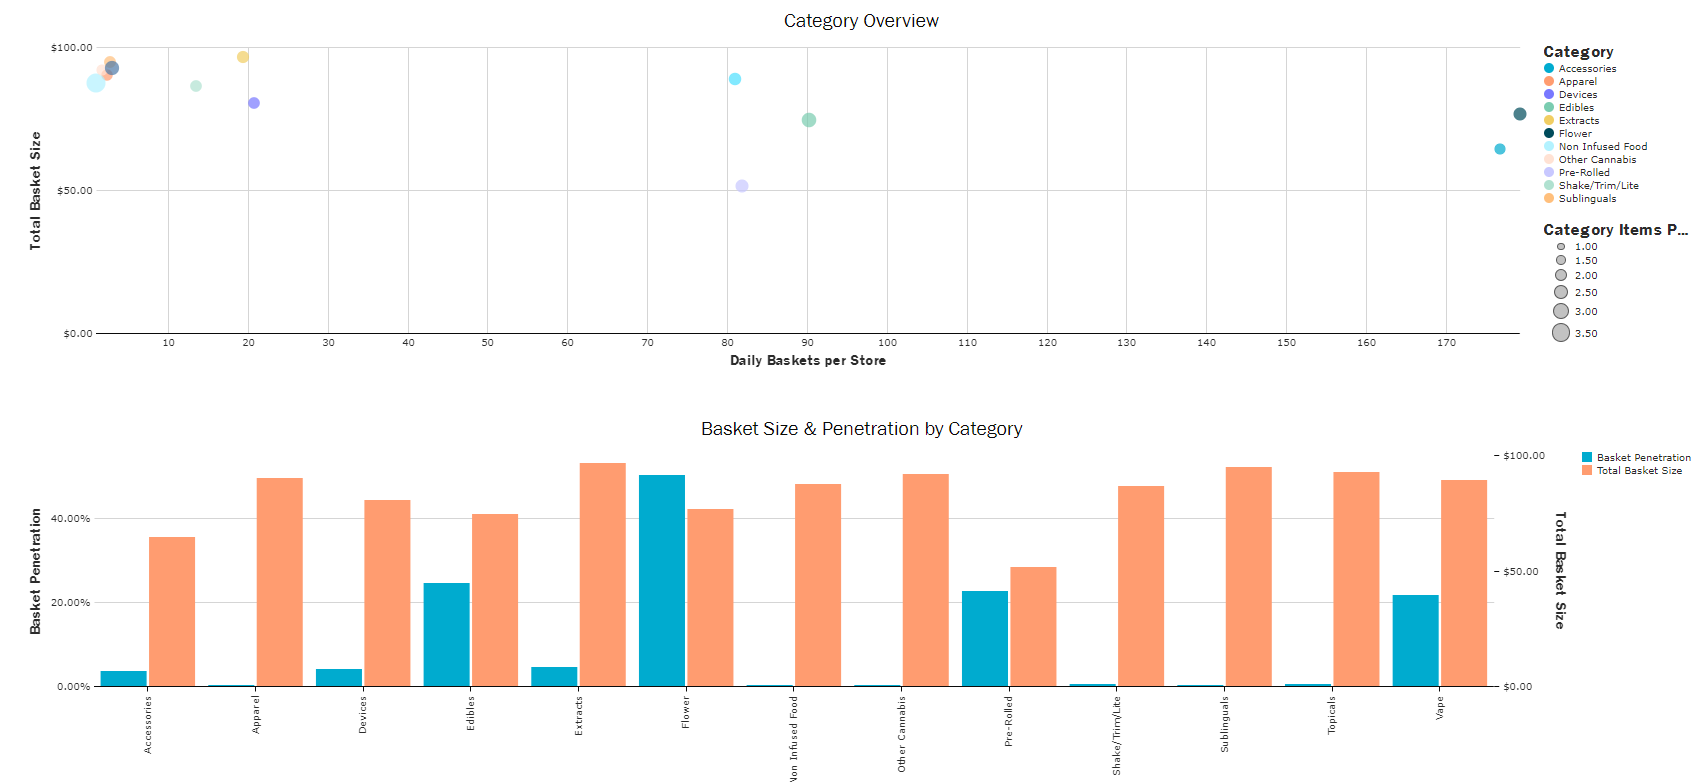
Start answering more in depth category performance by using the category changer to control the Category Overview and Basket Size & Penetration by Category visuals.
- Compare which categories bring in the largest basket size vs number of baskets using Category Overview.
- Note that each dot is sized by that category's items per basket.
- Basket Size & Penetration by Category gives a glimpse at how some categories can drive large purchases even if they aren't seen in a lot of baskets and vise versa.
Trended Overview
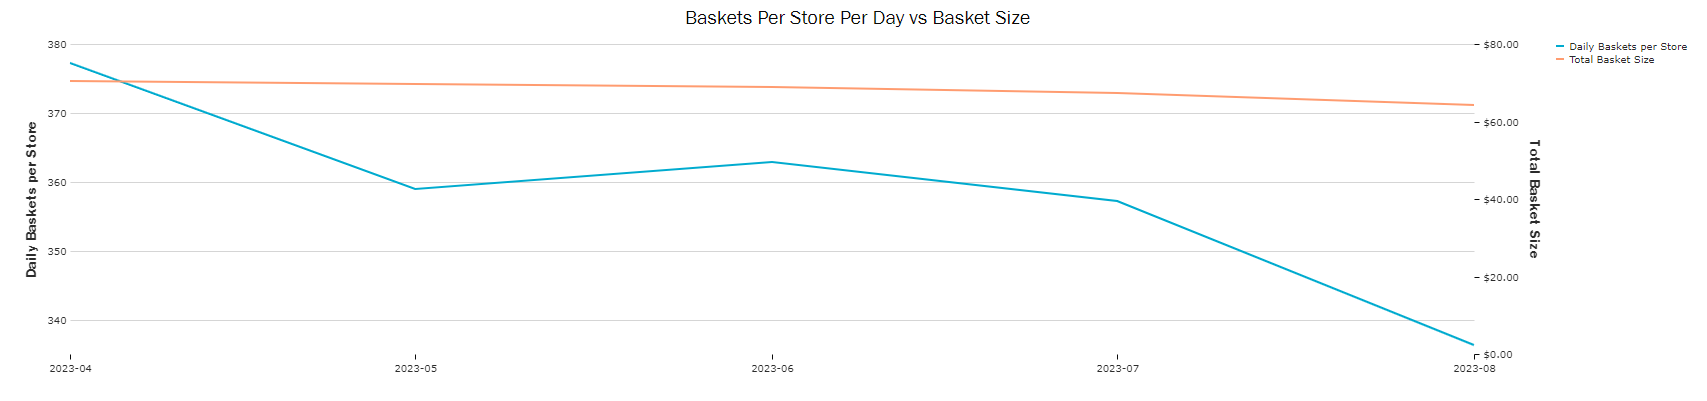
Use this visual to track basket size and number of baskets across available time periods.
- Track the relationship to basket size and the daily number of baskets per store to see if there's a relationship between purchasing a higher sales volume and the number of baskets sold.