
An overview of the brand house environment, owned brands, and how they compare to each other
Table of Contents
BDSA Verified Brand Houses Snapshot
Key Questions Answered
- How is my brand house performing compared to other brand houses?
- What is my brand house's market share vs. all independent brands?
- What brand houses are growing and declining in the market over time?
- What brands are most prominent in my brand house portfolio? What brands are most evident in my competitor's portfolio?
Brand House Filter
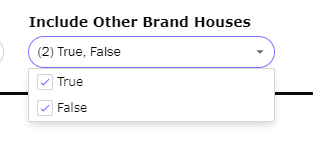
Use the "Include Other Brand Houses" filter to select if you'd like the "other" brands, which are all non-brand house-owned brands. When selected:
-
Both (default): Includes all
- True: Include only brand house-owned brands
- False: Include only non-brand house-owned brands

BDSA Verified Brand Houses Snapshot

An overview of KPIs specified to brand houses. Filter to specific markets and categories to understand the diversity of brands in particular markets and categories using the total market snapshot as a benchmark.
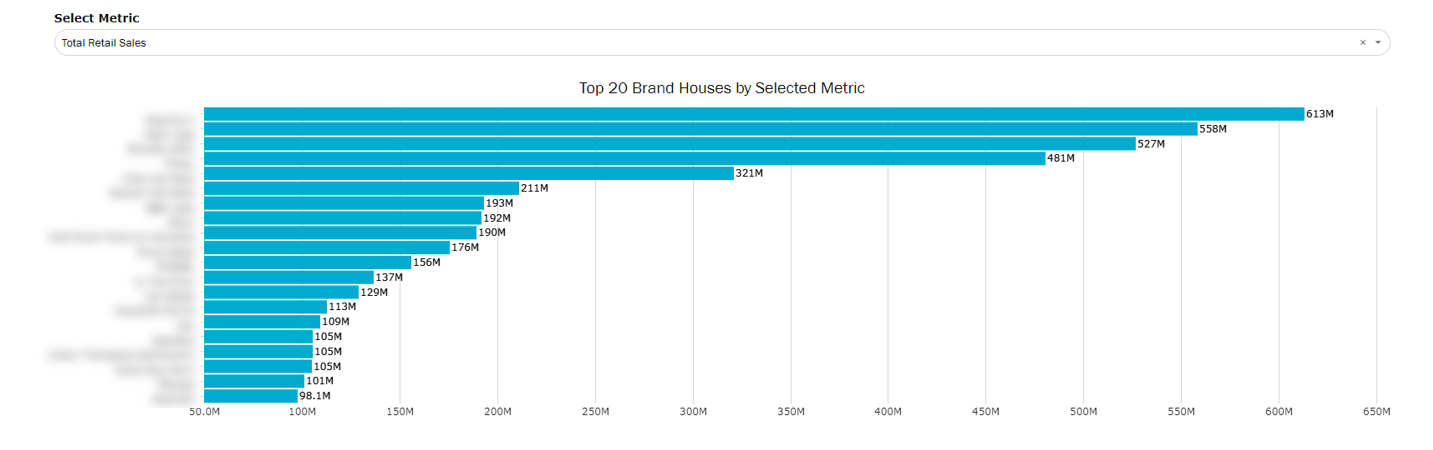
View all BDSA-verified brand houses, ranked by the select metric in the above drop down.
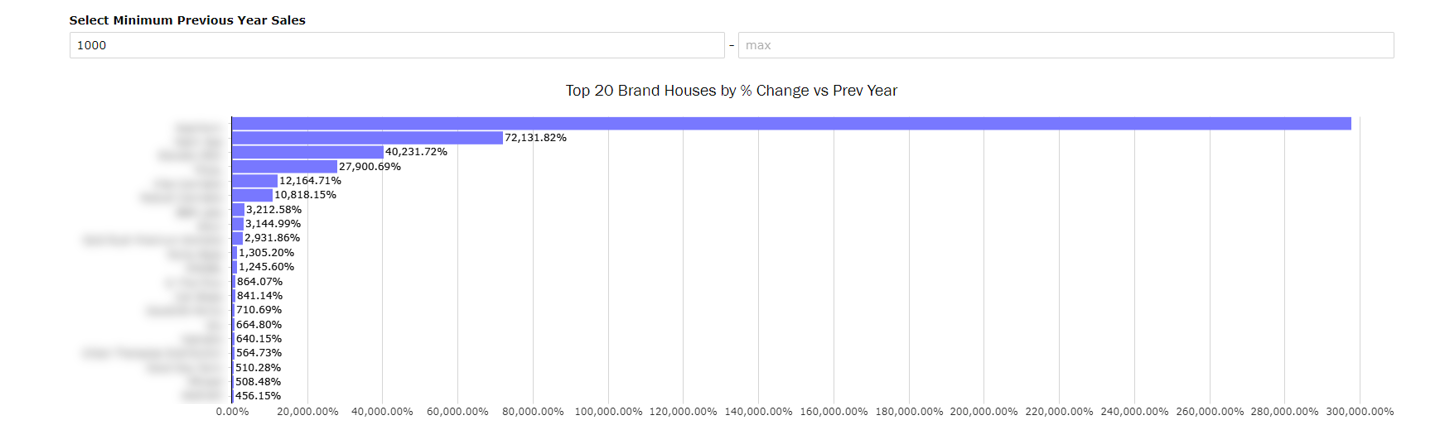
Rank brand houses by growth vs the same period in the previous year rather than top total sales to track up and coming brand houses.
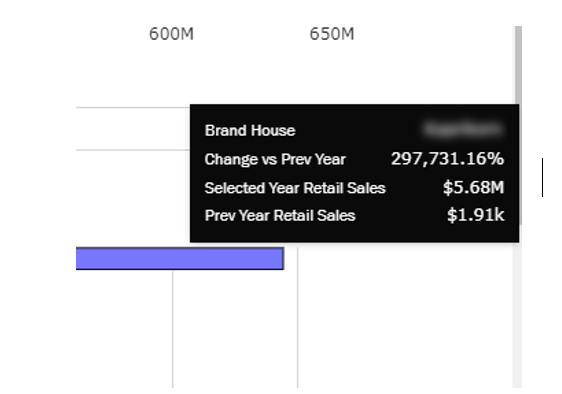
- Comparison is the same time period for the previous year.
- Ex: selecting January - March 2023 in the date filter will compare to January - March 2022
- Hover over any of the bars to see current period and same period previous year total sales
- Use the "Set Minimum Previous Year Sales" toggle to only see brand houses that fit a certain sales volume the year before what is selected in the date filter.
- Ex: only wanting to see top brand growth among well established brands by setting the previous year minimum to a higher number than if doing an analysis on newer brands by setting it lower.
- Default is 1000 to avoid overinflated % change for very small previous year brand sales
Tops Brands Extracts
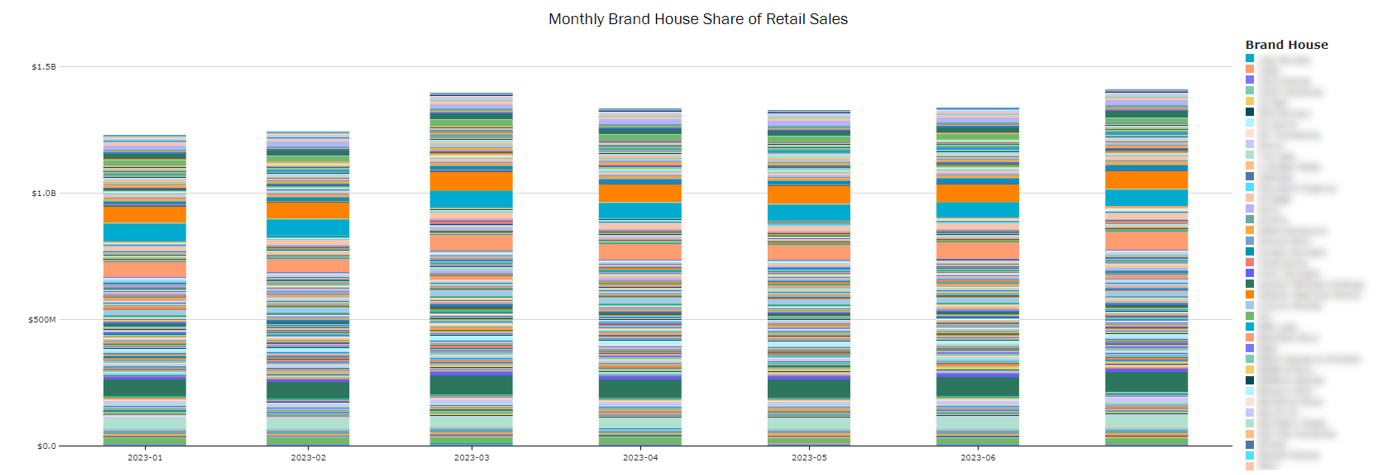
A trended monthly view of market share for all brand houses.
- Use the "Include Other Brand Houses" filter to remove "Other" from the comparison chart
Tip: This works best when filtered to a particular market or category or when selecting a few brand houses to compare.
State Brand House Sales
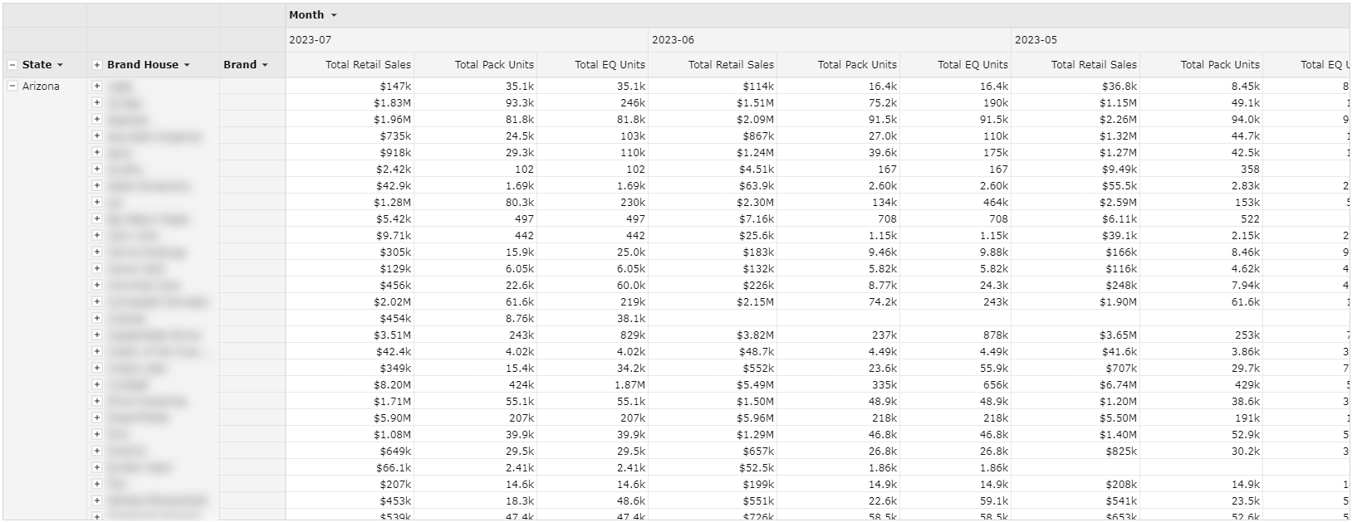
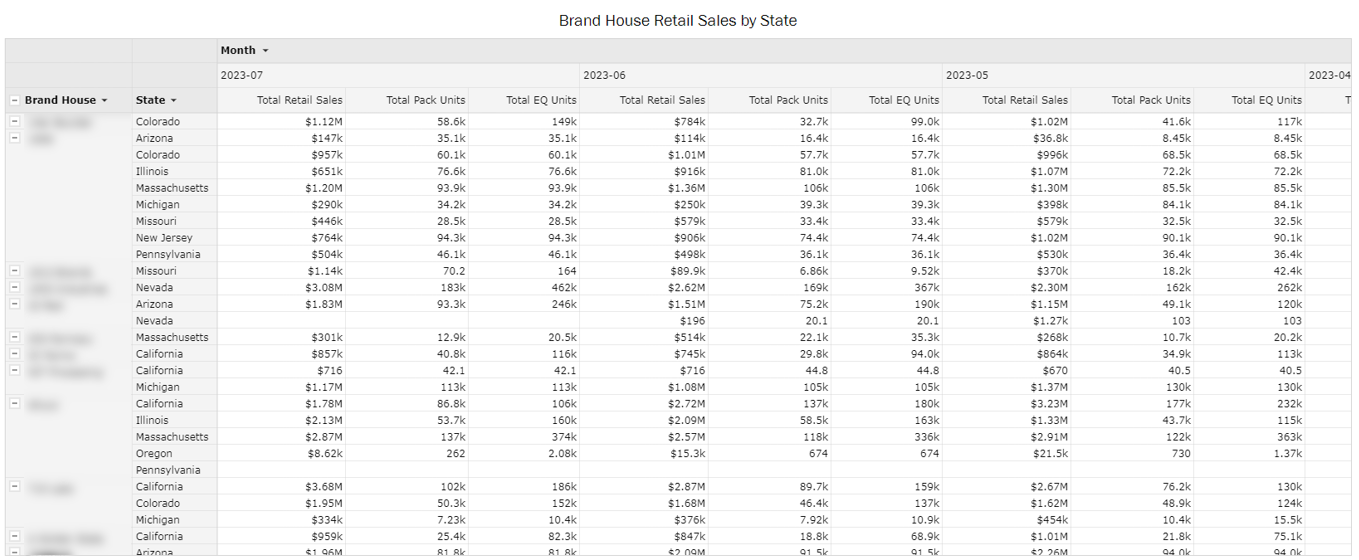
Two different views show all brand houses in a specific state and all states in which a brand house sells. Use these to understand a brand house's distribution and how many brand houses are in each state.
BDSA Verified Brand Houses Export
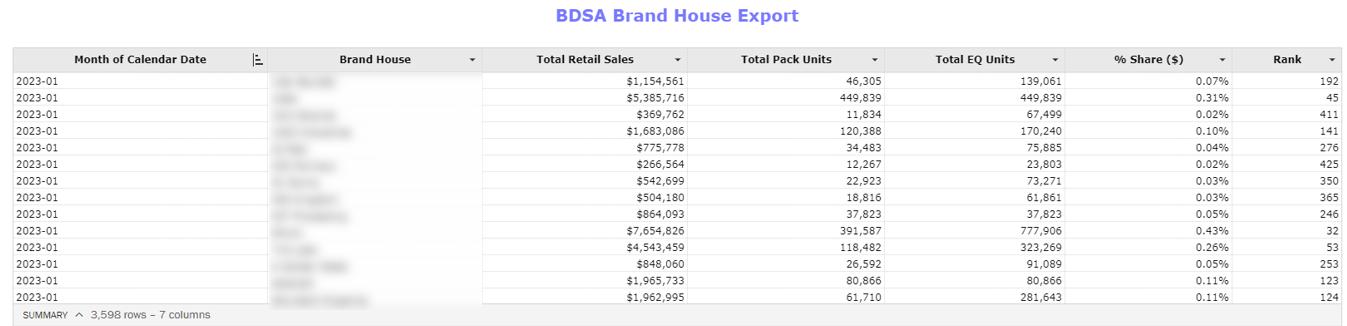
Exportable trended table with main KPIs of each parent company ranked by total dollar sales.
- Rank is based on total retail sales and relative to the month, so rank will change month to month