Table of Contents
Key Questions Answered
- What categories have grown the most over the past year?
- How is my brand's category mix? Is my brand under or overperforming in a certain category?
- What attributes and formats are most popular across different categories?
- I'm planning to expand my brand's assortment. What pack sizes are most in demand in the categories I play in?
Sections
Use the tab at the bottom of the screen to switch to different category types for a more in depth attribute analysis.
- Dried Cannabis
- Flower and Pre-Roll
- Cannabis Extracts
- Extracts and Vapes
- Edible Cannabis
- Beverages, Candy, and Chocolate

Assortment Categories
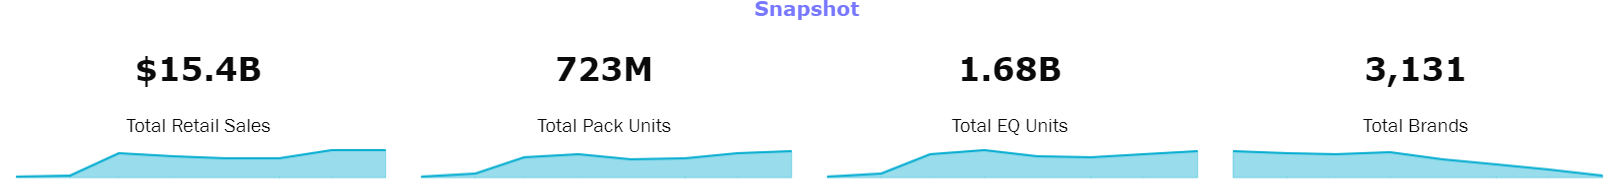
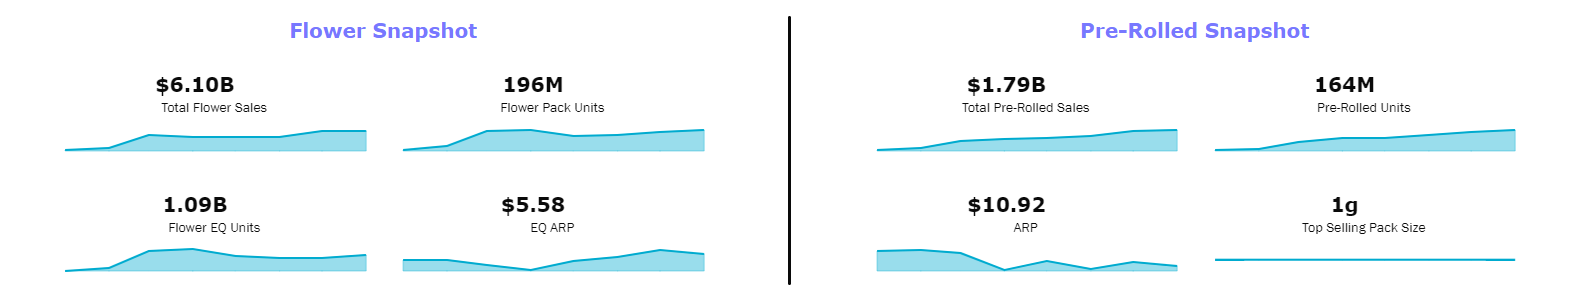
Get an overall snapshot of market KPIs. Utilize filters to get high level insights into a market or category in a specific time period. Will be reflective of the category specific characteristics as the tabs change.
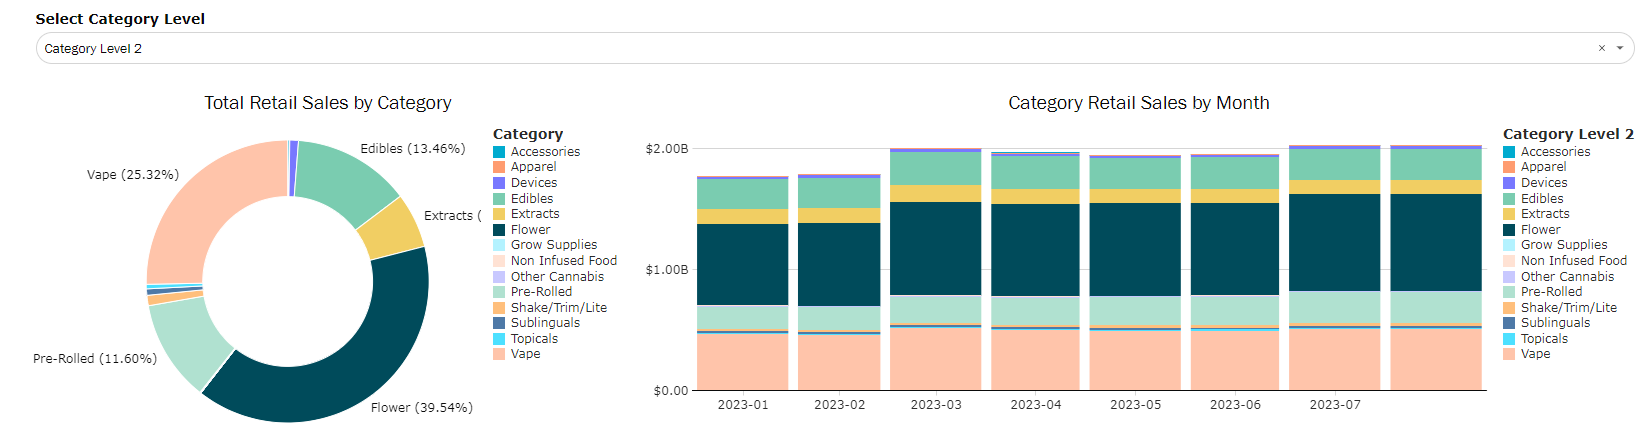
Evaluate category share at different levels of the hierarchy at a point in time as well as trending over a chosen time period.
- Use to evaluate growth and decline of certain categories to prioritize your own brand's portfolio and strategy for new products.
- Use the drop down to change the category level reflected.
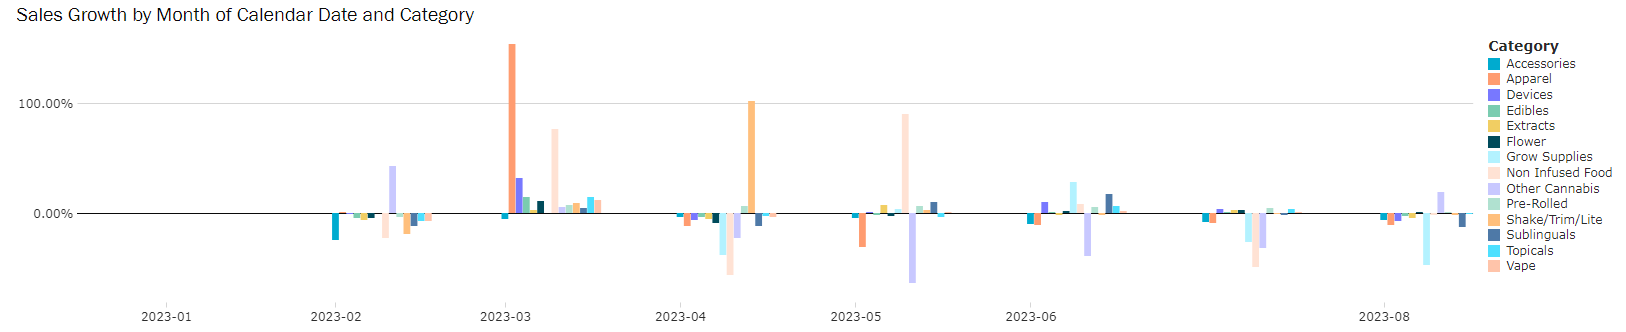
Complete the trending category story by looking at month to month category growth and decline over a chosen time period.
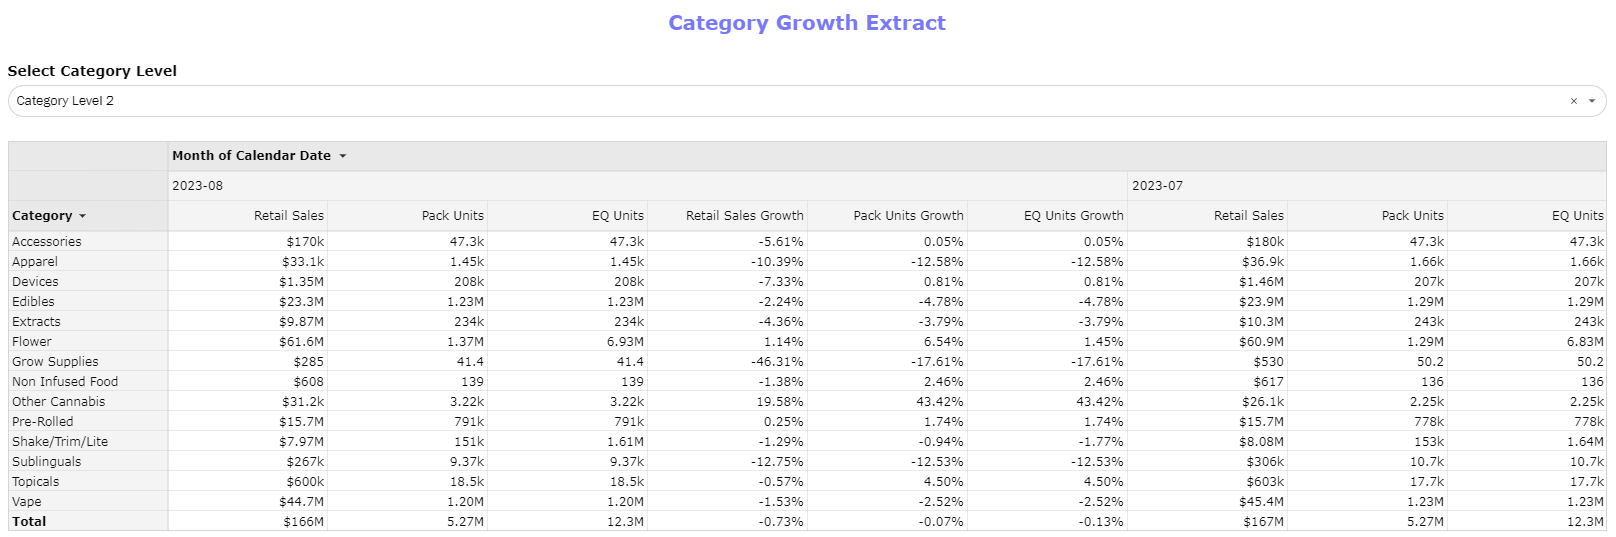
Export main metrics with month to month growth
Dried Cannabis
Designed to focus on attributes specific to Flower and Pre-Rolls. Note that all filters will be reflective of this specific set of data. This dashboard can be used to track attribute trends in a market, identify innovation opportunities, and gauge what is driving total revenue across attribute types.
Flower
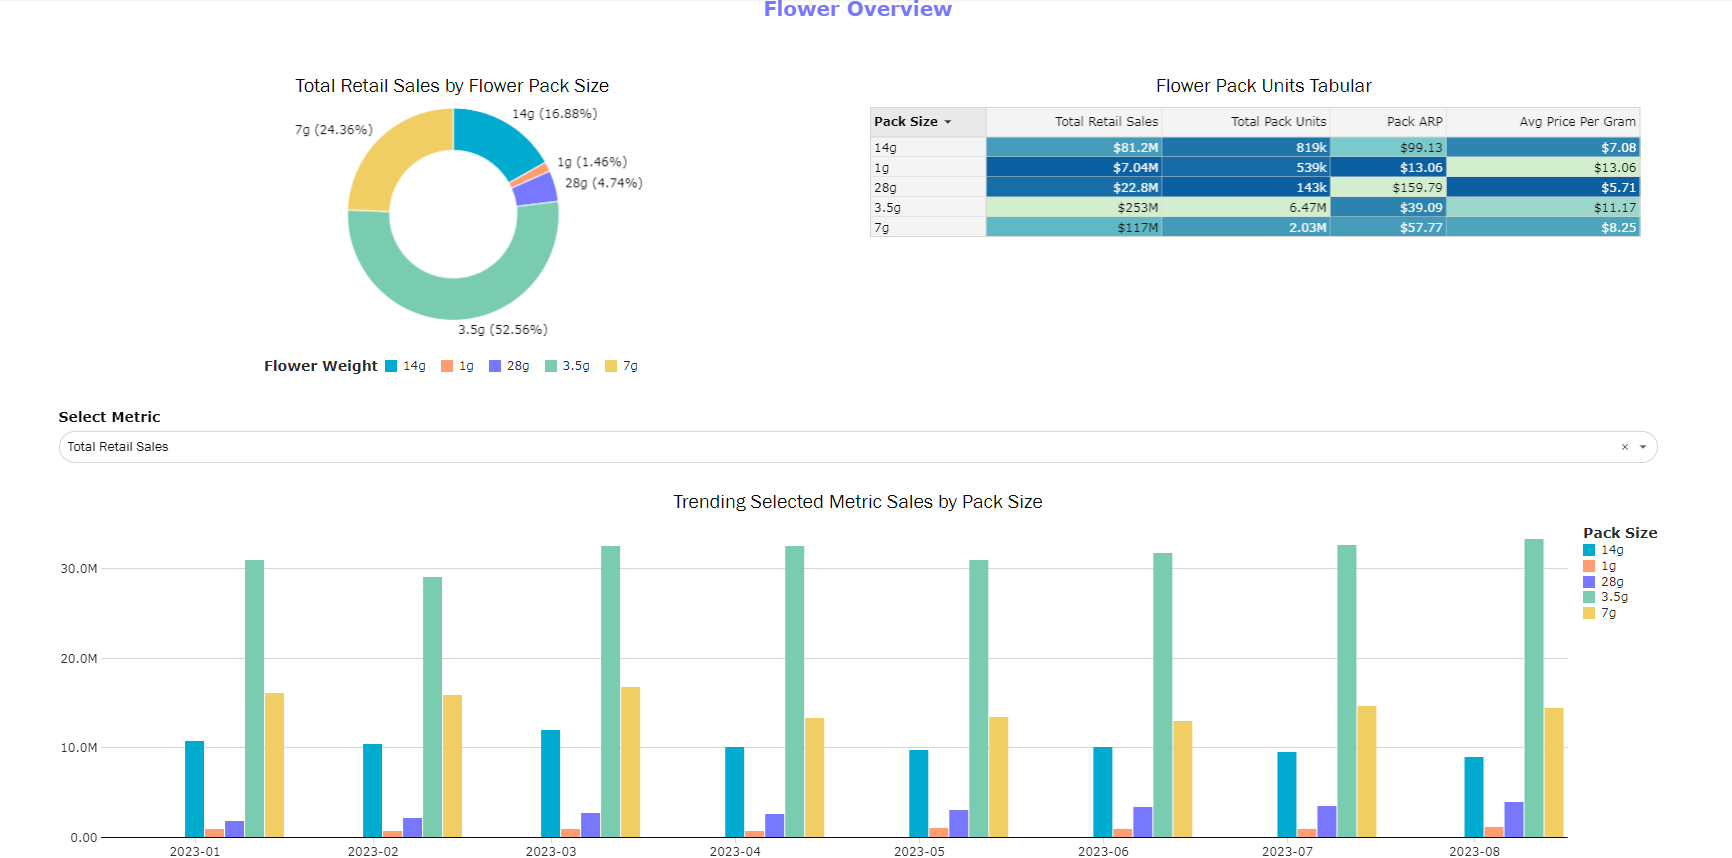
Use the overview section to gain insight into how pack sizes are trending in the market across different metric types.
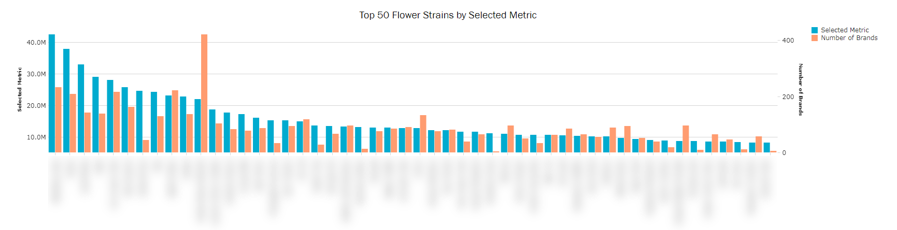
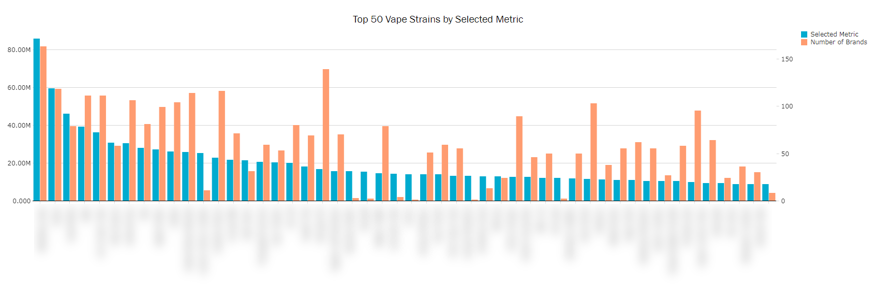
Track the top selling strains, as well as the number of brands selling them.
- Can help unpack if a strain is successful because it's a popular consumer strain, or driven by a specific brand's loyalty.
- If wanting to remove any generic strains, right click on the bar for that strain and click "Exclude"
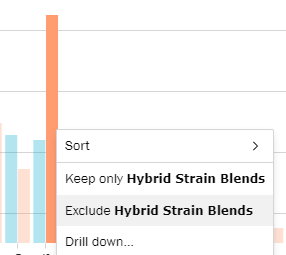
- Doing this will re-sort and give you the top 50 excluding that value.
Pre-Rolled
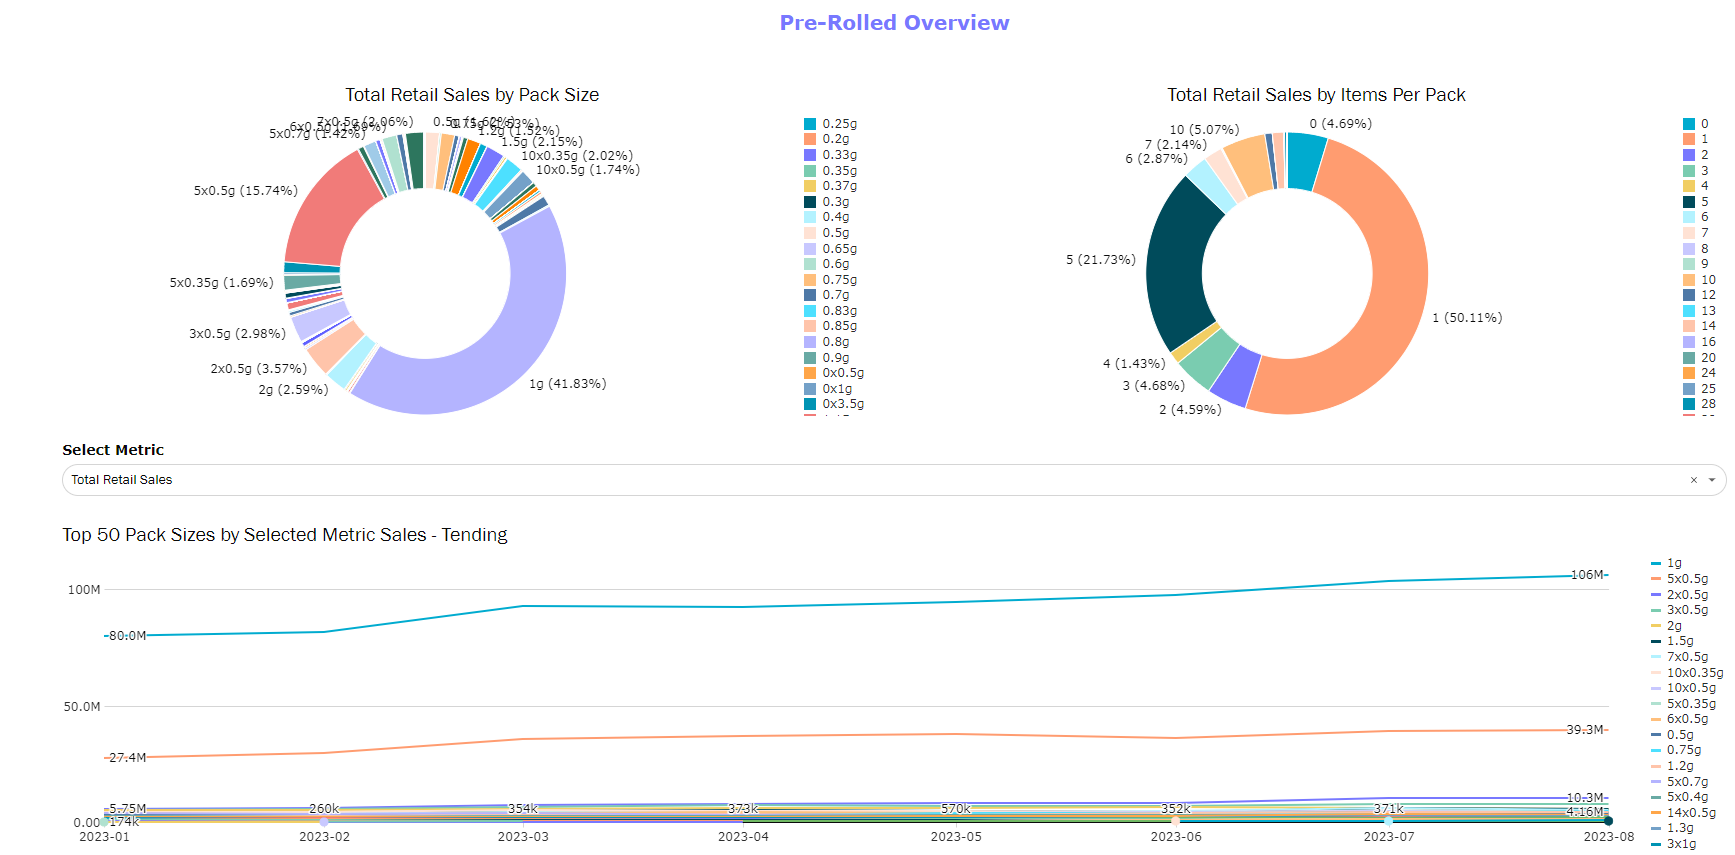
Track the total pack size, which includes grams per pre-roll and the total pack size, vs just the popularity of a certain number of items per pack.
- Follow top 50 on a trended line to track popularity change over time
- Use the brand filter to see how new product launches have affected sales across the brand's portfolio
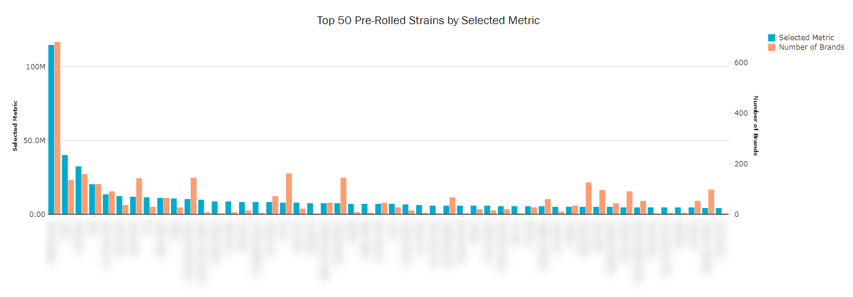
Track the top selling strains, as well as the number of brands selling them.
- Can help unpack if a strain is successful because it's a popular consumer strain, or driven by a specific brand's loyalty.
- If wanting to remove any generic strains, right click on the bar for that strain and click "Exclude"
- Doing this will re-sort and give you the top 50 excluding that value.
Cannabis Extracts
Designed to focus on attributes specific to Extracts and Vapes. Note that all filters will be reflective of this specific set of data. This dashboard can be used to track attribute trends in a market, identify innovation opportunities, and gauge what is driving total revenue across attribute types.
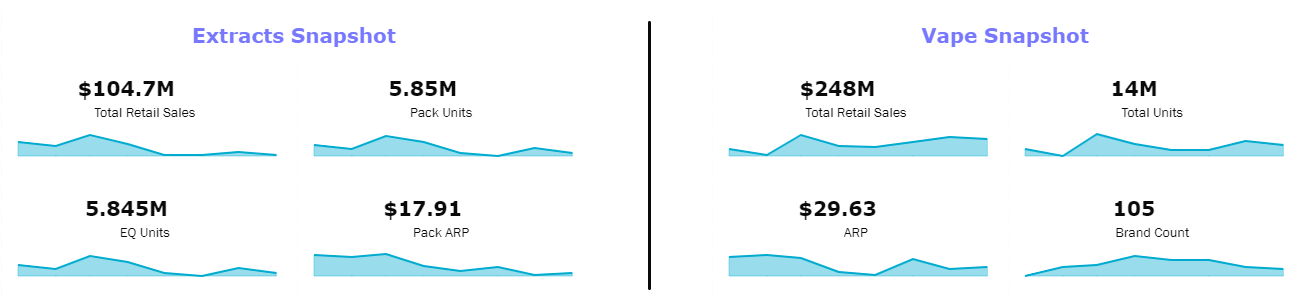
View a high level snapshot of the categories' overall performance.
Extracts
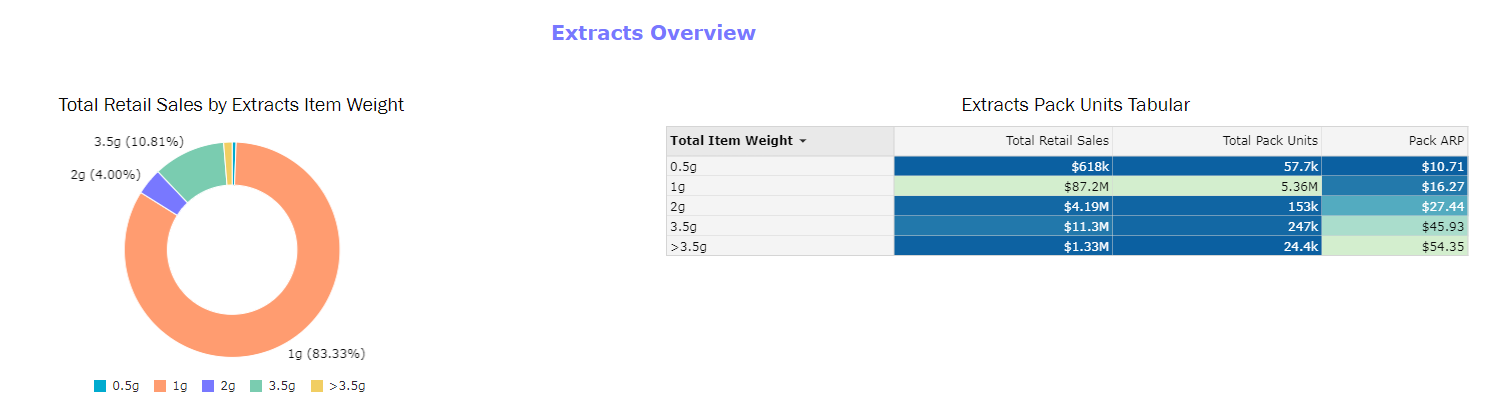
Point in time tracking of share, total sales, units, and ARP for different Extract sizes.
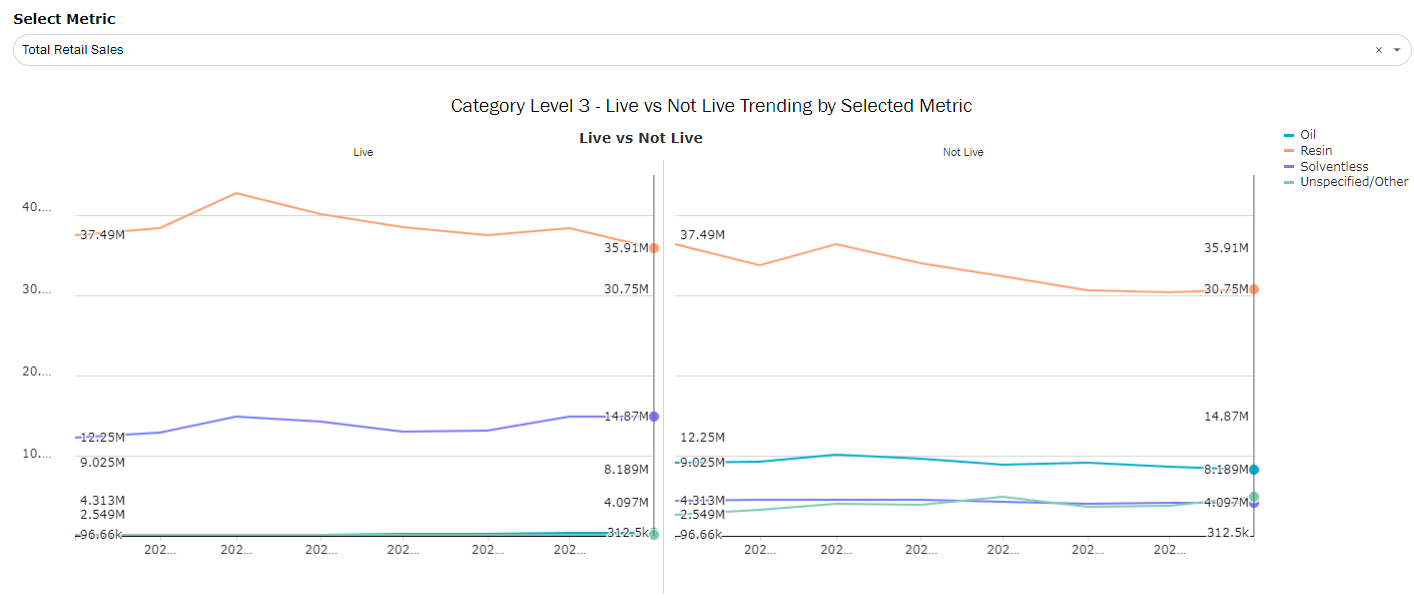
Compare the performance of live vs not live extracts across level 3 Extract categories.
- Understand popularity overtime of live vs not live, as well as being able to compare pricing and units.
- Use units to get an unweighted understanding of volume sold due to the price difference between the two attributes.
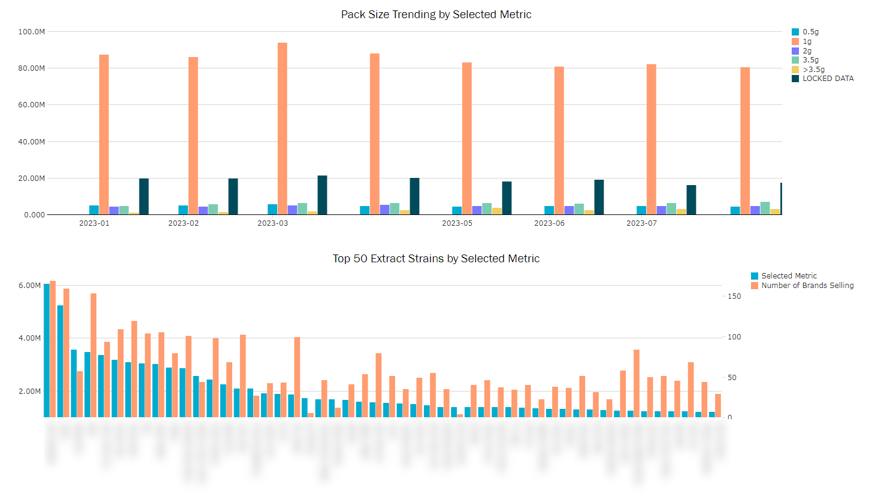
Follow total size trends as well as strain popularity.
- Layering in number of brands can help unpack if a strain is successful because it's a popular consumer strain, or driven by a specific brand's loyalty.
Vape
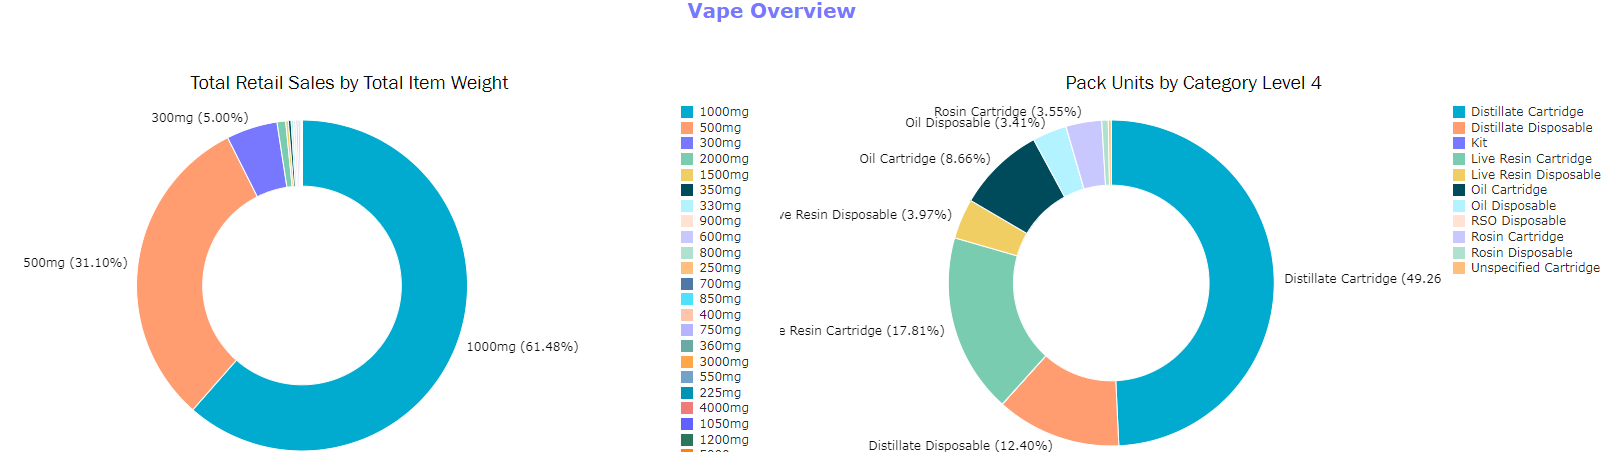
Track total share of item weight and share of Vape types at category level 4.
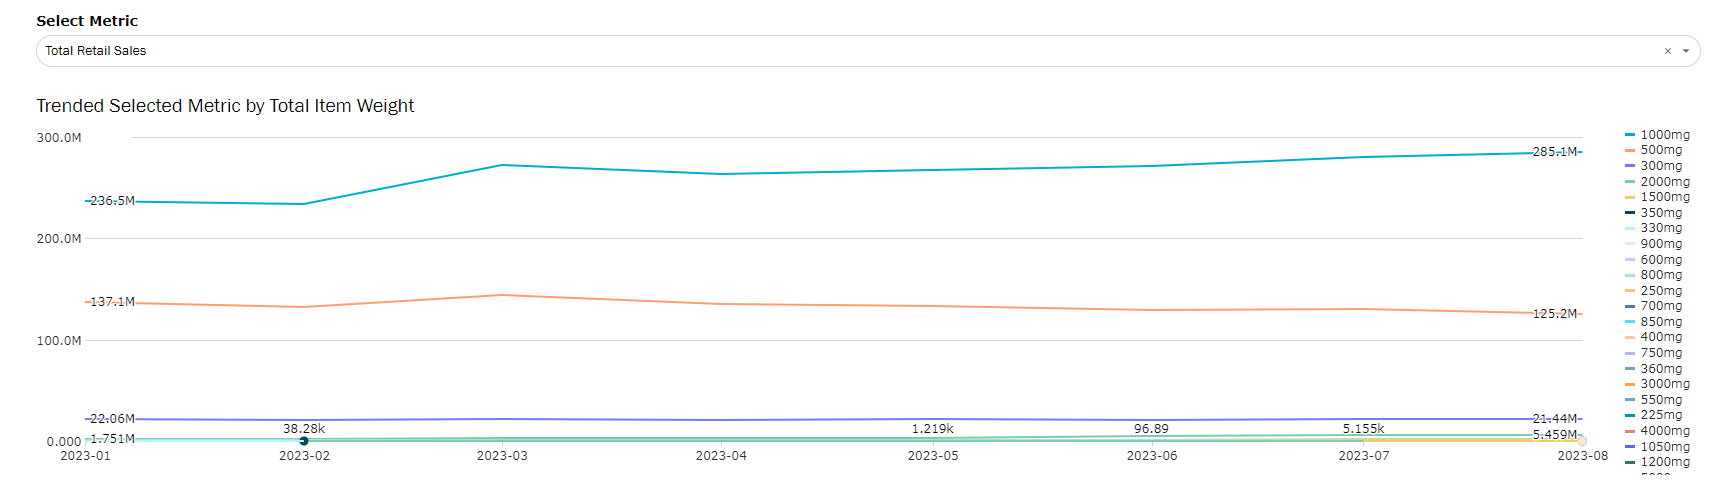
Follow trends of the most popular vape weights over a selected time period.
- Track trends across total retail sales, ARP, and units but using the metric toggle above the visual.
Follow total size trends as well as strain popularity.
- Layering in number of brands can help unpack if a strain is successful because it's a popular consumer strain, or driven by a specific brand's loyalty
Edible Cannabis
Designed to focus on attributes specific to Candy, Chocolates, and Beverages. Note that all filters will be reflective of this specific set of data. This dashboard can be used to track attribute trends in a market, identify innovation opportunities, and gauge what is driving total revenue across attribute types.
All visuals are the same in each section, but specific to one of the 3 categories. Will use Candy as the example.
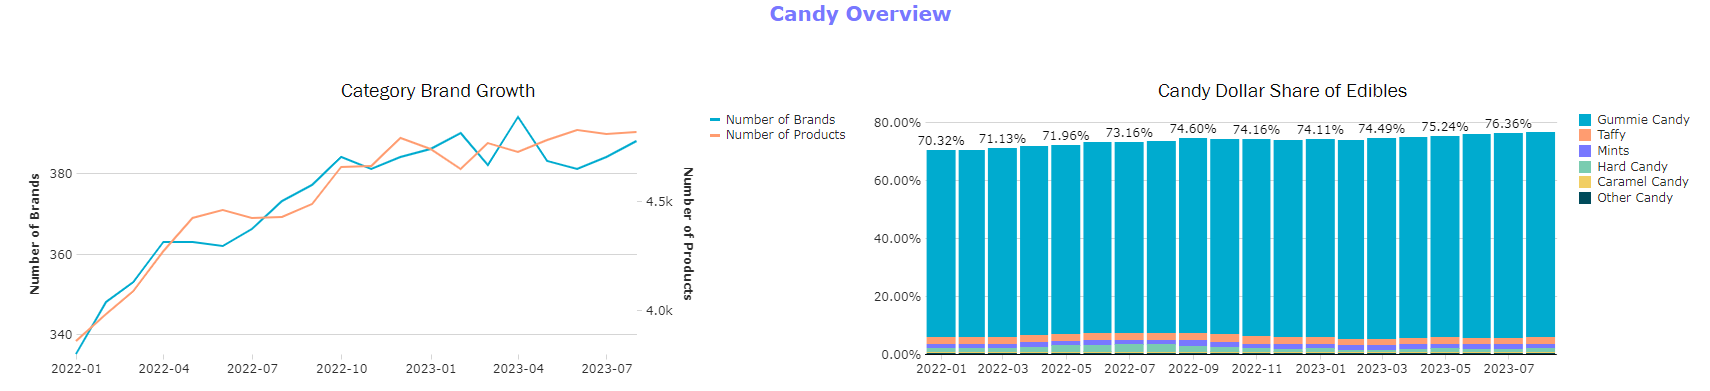
- Track the expansion of the category over time looking at the increase in the number of brands and products in the category.
- Translate this to the share change of total edibles as the number of offerings change overtime.
- Can help evaluate if a category is saturated or is expansion is leading to increased revenue growth.
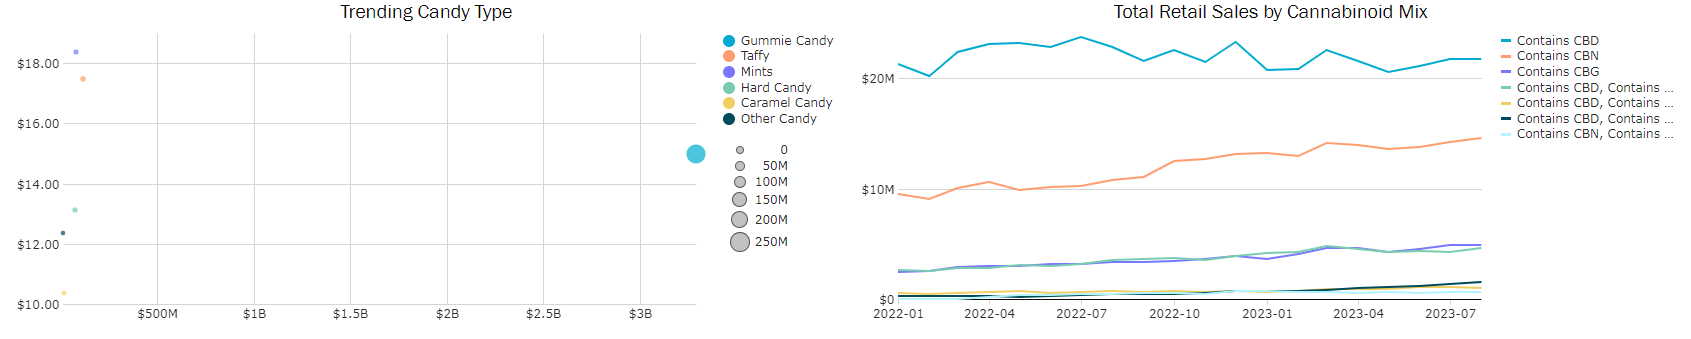
- Cross reference candy categories between the average price and total sales.
- Evaluates a category at a more wholistic
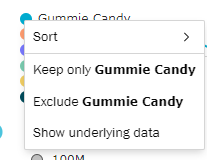
- Exclude any outlier data to see some of the smaller categories by right clicking the category and clicking "Exclude"
- Dive deeper into attributes by viewing total retails ales, units, and ARP differences overtime by cannabinoid mix.
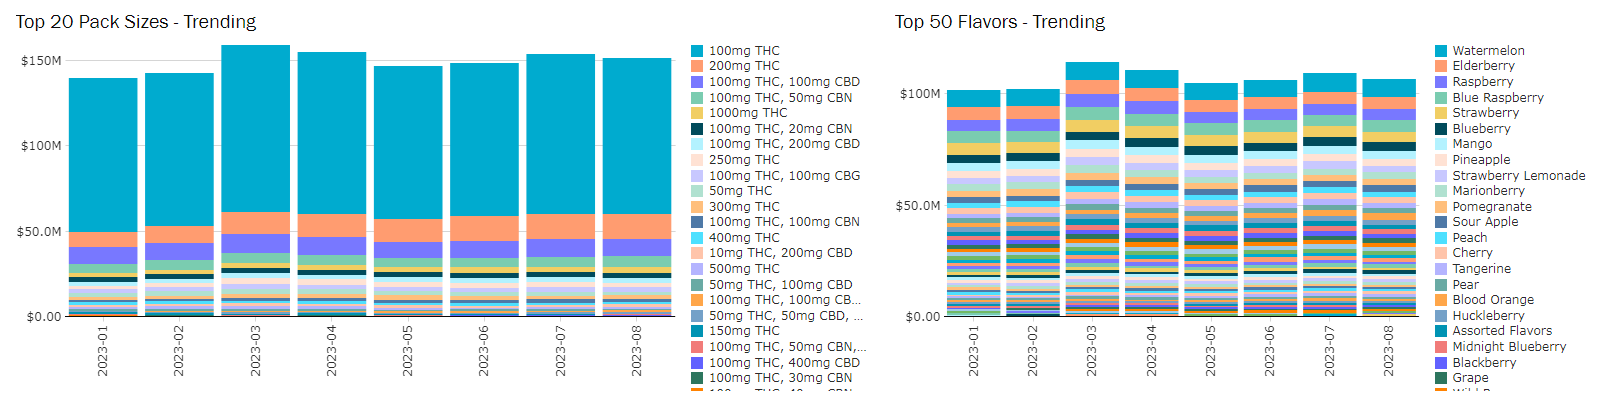
- Compare share of pack size and flavor to understand very granular popularity in a market, or filter to a brand and understand how a brand's assortment compares to overall market trends.