Objective
This SOP outlines how to use the Promotion Tracker Dashboard to evaluate the effectiveness of retail promotions. Users can compare promotion types, measure sales and profit lift, and identify which deals drive the greatest impact versus which erode margins.
Dashboard Controls
-
Competitive Radius
-
Define the radius (minutes or miles) to compare your stores (blue) vs. competitors (red).
-
-
Filters
-
Date range
-
Brand house / brand
-
Product / pack size
-
Location tier
-
First-party brands
-
-
Load / Save Territory
-
Save selected groups of stores for recurring analysis.
-
Key Steps
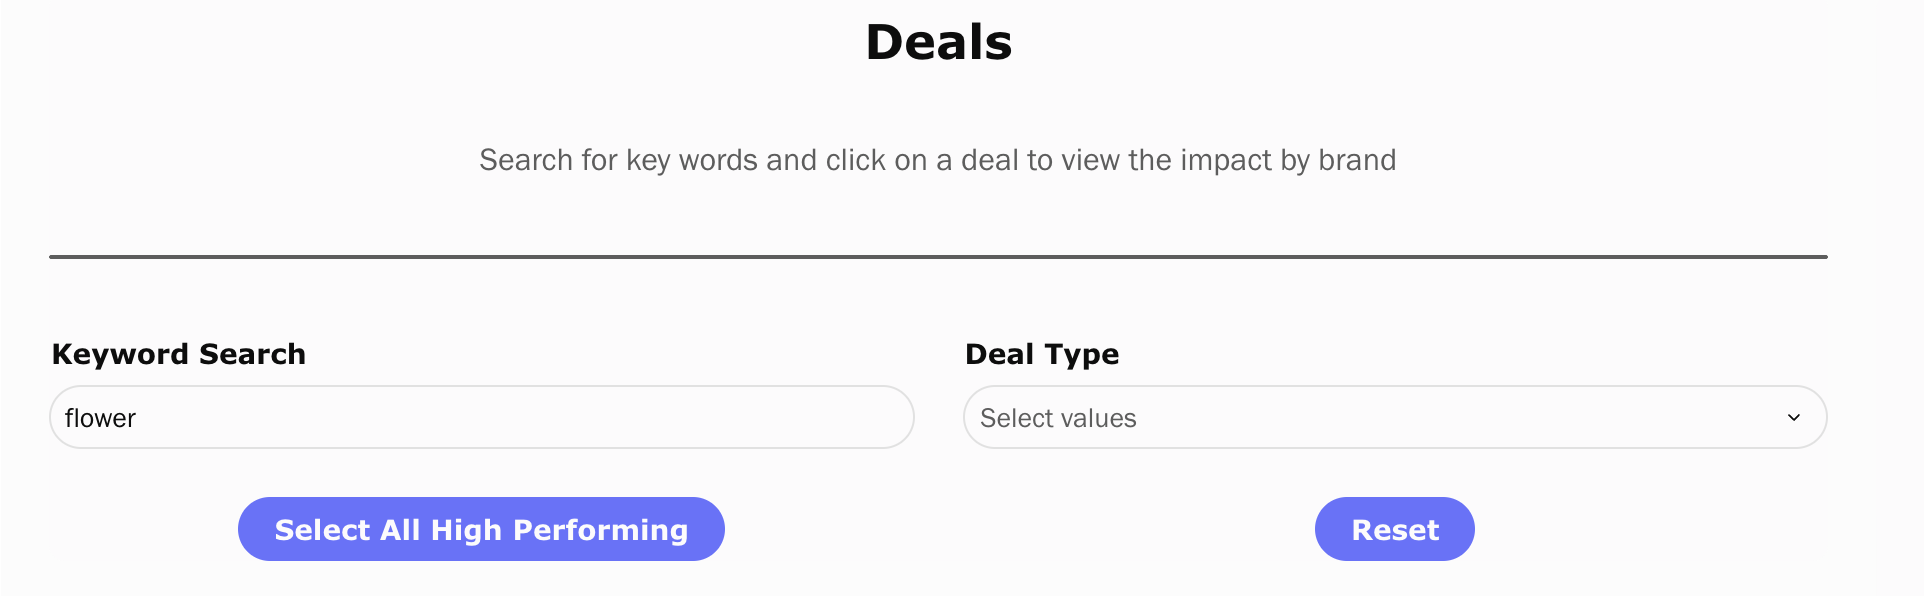
1. Search for Promotions
-
Use the Keyword Search or Deal Type filter to find specific promotions (e.g., “Buy 1 Get 1” or “Flower”).
-
Selected deals populate performance metrics on the right-hand side.
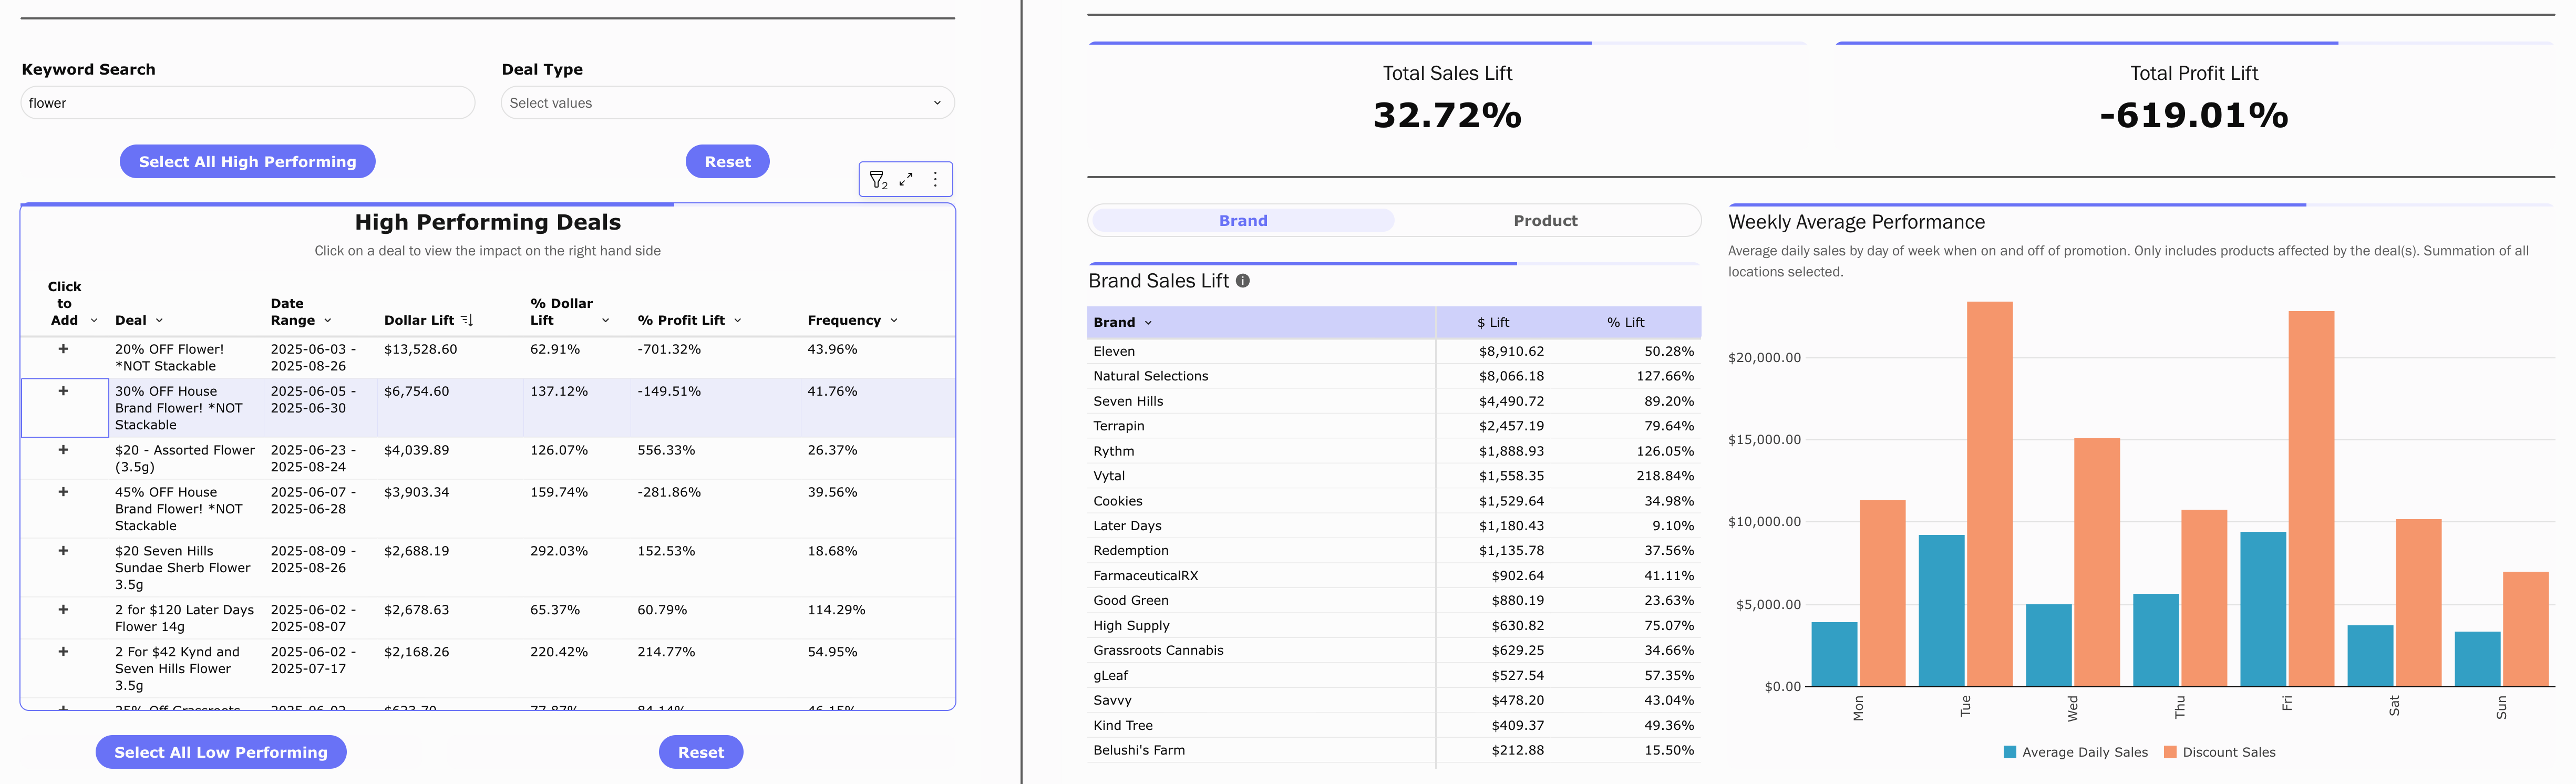
2. Analyze High and Low Performing Deals [0:30]
-
High Performing Deals show strong sales or profit lift.
-
Low Performing Deals highlight underperforming or margin-negative promotions.
-
Click a deal in either list to display its detailed performance.
3. Deal Performance Metrics
-
For each deal, review:
-
Dollar Lift – total incremental revenue generated.
-
% Dollar Lift – percentage increase in sales.
-
Profit Lift & % Profit Lift – impact on profitability.
-
Frequency – % of days the deal was active.
-
4. Brand and Product Impact
-
On the right side, view Brand Sales Lift or toggle to Product.
-
See which brands/products benefited most from the promotion.
5. Weekly Average Performance
-
Chart shows average daily sales on vs. off promotion by day of week.
-
Identify which days of the week respond best to promotions.
6. Compare Against Competitive Set
-
Daily Sales Performance vs Competitive Set benchmarks your promotion results against:
-
My Locations (Not on Promo)
-
Competitive Set Average
-
-
Helps validate whether the promotion outperformed or lagged behind competitors.
7. Track Deal Type Trends Use the Deal Type % Lift chart to evaluate categories of promotions (e.g., 40% Off, Bundle Deals, Day of Week Deals).
-
Click any bar to filter the dashboard by that deal type.
8. Add Multiple Deals to Compare
-
Use the + icon next to each deal to add it to your analysis set.
-
Compare combined impacts of different discount strategies.
9. Exporting Data
-
Use the three-dot menu on charts/tables to export to Excel or CSV.
-
Copy visuals directly for reporting or presentations.
Cautionary Notes
-
A promotion can show high sales lift but negative profit lift — always check both.
-
At least two competitor stores are required to generate market benchmarks.
-
Promotions with low frequency may not provide reliable performance signals.
Tips for Efficiency
-
Use keyword search (e.g., “Flower” or “Buy 1 Get 1”) to quickly filter promotions.
-
Focus first on High Performing Deals to replicate success.
-
Review day-of-week lift patterns before scheduling promotions.
-
Group deals by type (percentage discount, BOGO, bundles) to compare effectiveness.