Table of Contents
Total Cannabis Sales - Trending
Key Questions Answered
- What are the total market sales for this past month? How does that compare to other markets I'm subscribed to?
- How have sales in a market grown or declined over time?
- How many brands are operating in a market?
- Are more brands focusing on one category? Or do they have products in multiple?
Market Snapshot
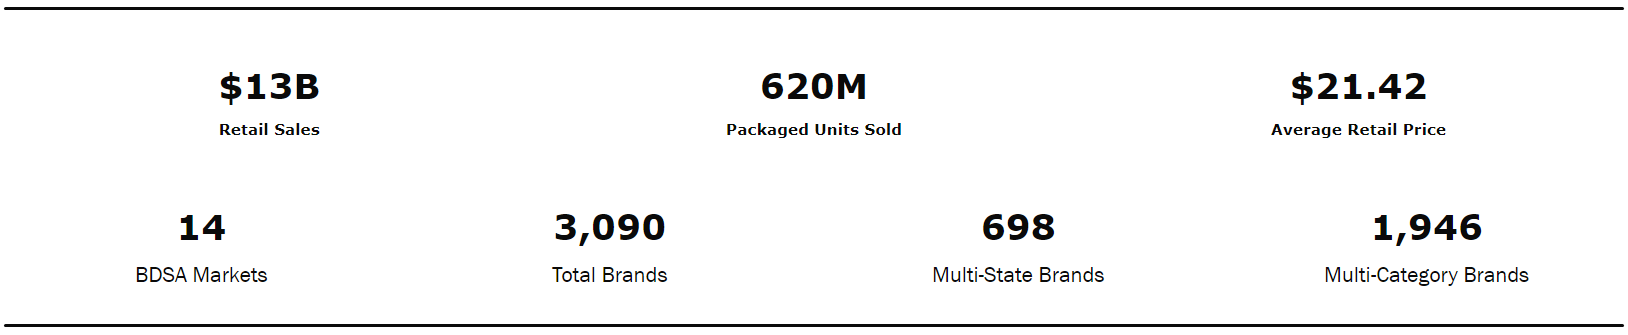
Get an overall snapshot of market KPIs. Utilize filters to get high-level insights into a market or category in a specific period. Read more about multi-state and category brands here.
Trended Cannabis Sales
Track major KPIs over a selected period.
- Use the filter panel to adjust the screen's period, state, category, and other information.
- Use the Metric Selection options for Retail Sales, Pack Units, EQ Units, Pack ARP, and EQ ARP. Selecting one of these options will update the metric referenced in the charts in this section only.
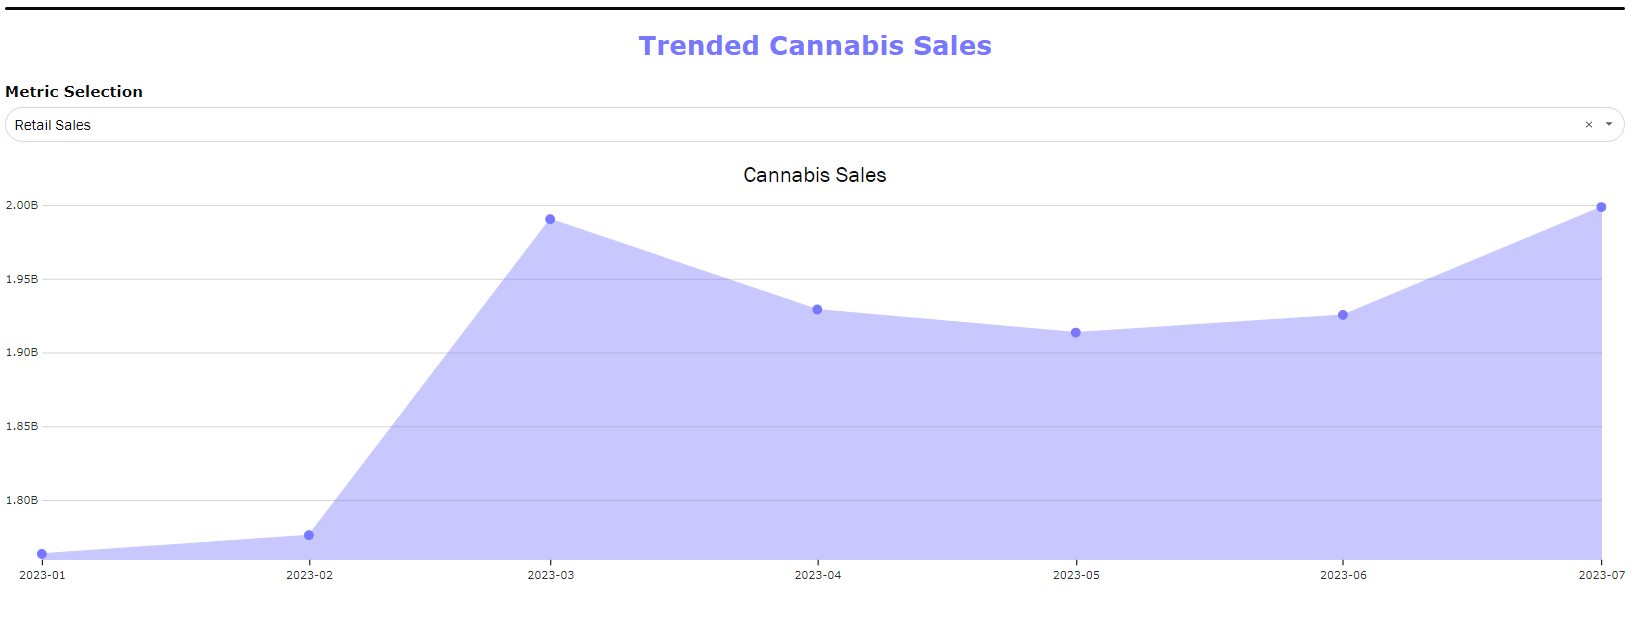
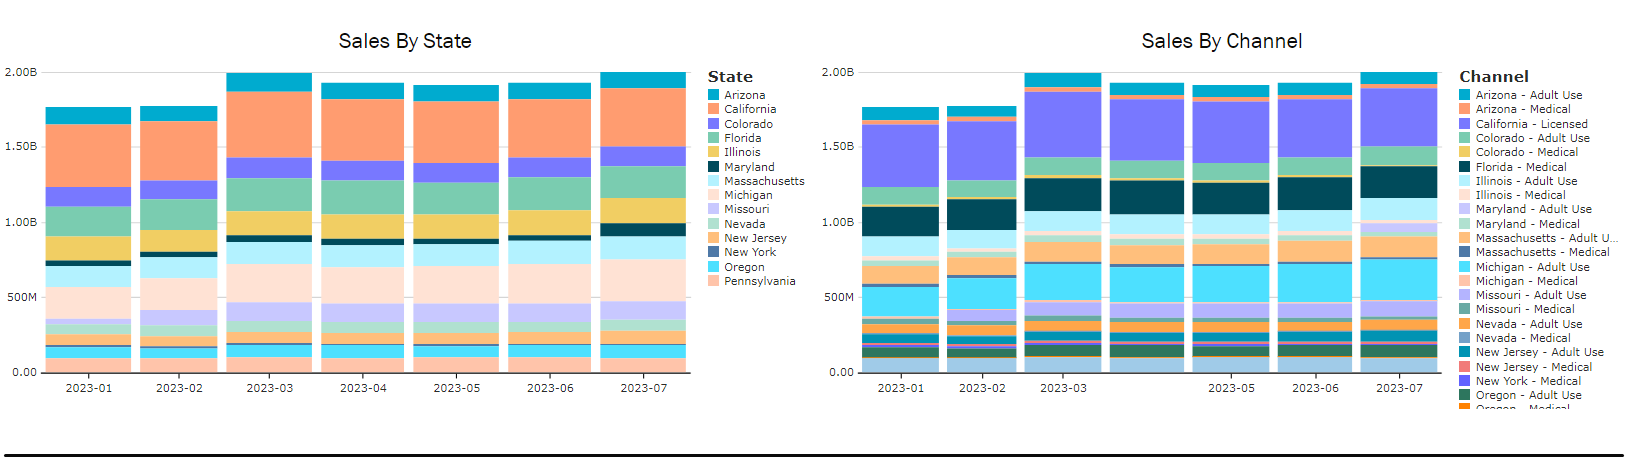
The additional charts in this section chart the trending data by state and channel. The market data available to you will depend on your subscription.
Category Mix
Understand the share of each category across the BDSA hierarchy
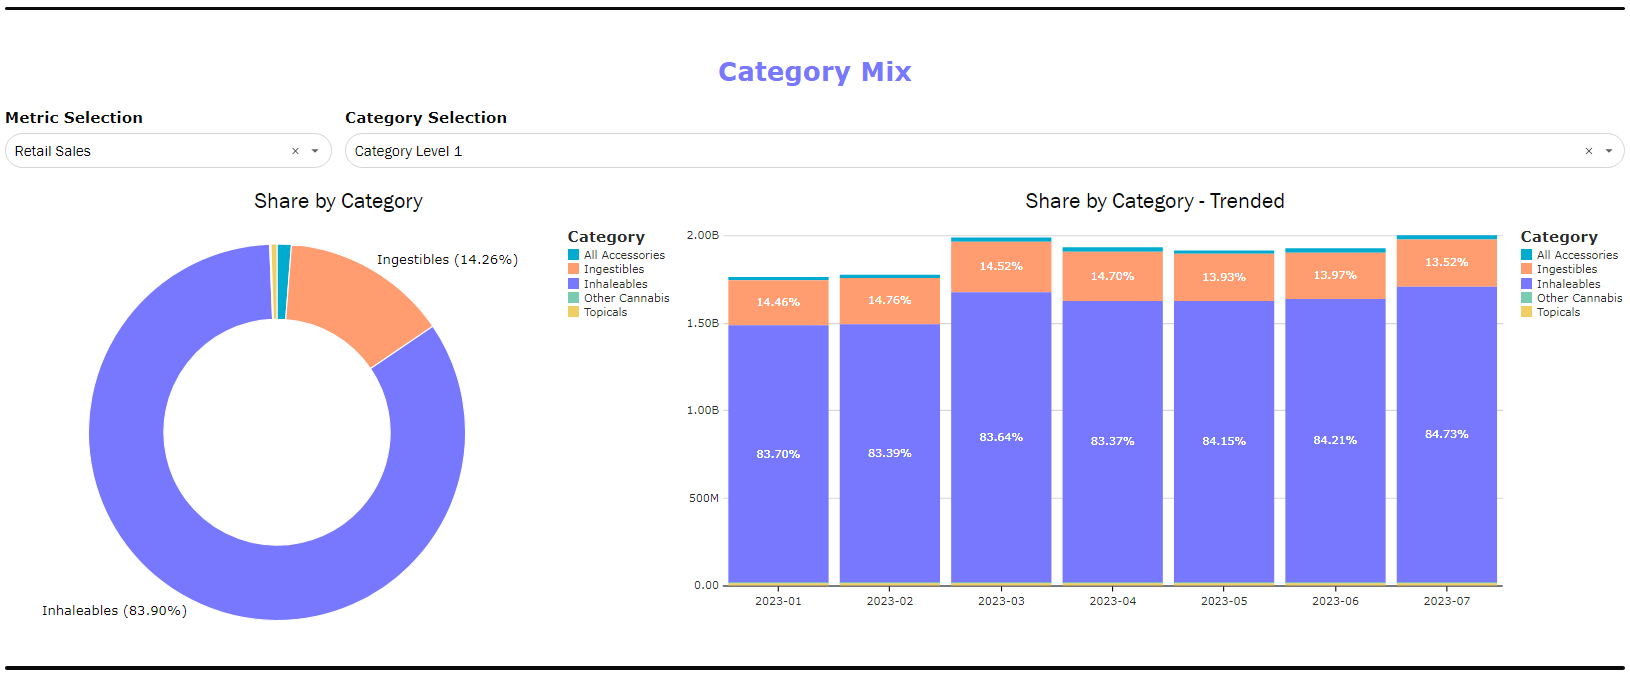
Use the metric and category selections to break down the market share of each category. Compare a single point in time (set by the date filter) against monthly share trends to gauge which categories are gaining and losing share.
This is also helpful for evaluating a brand or brand house's category mix performance by applying a single brand or brand house filter to the filter panel.
Category Pricing
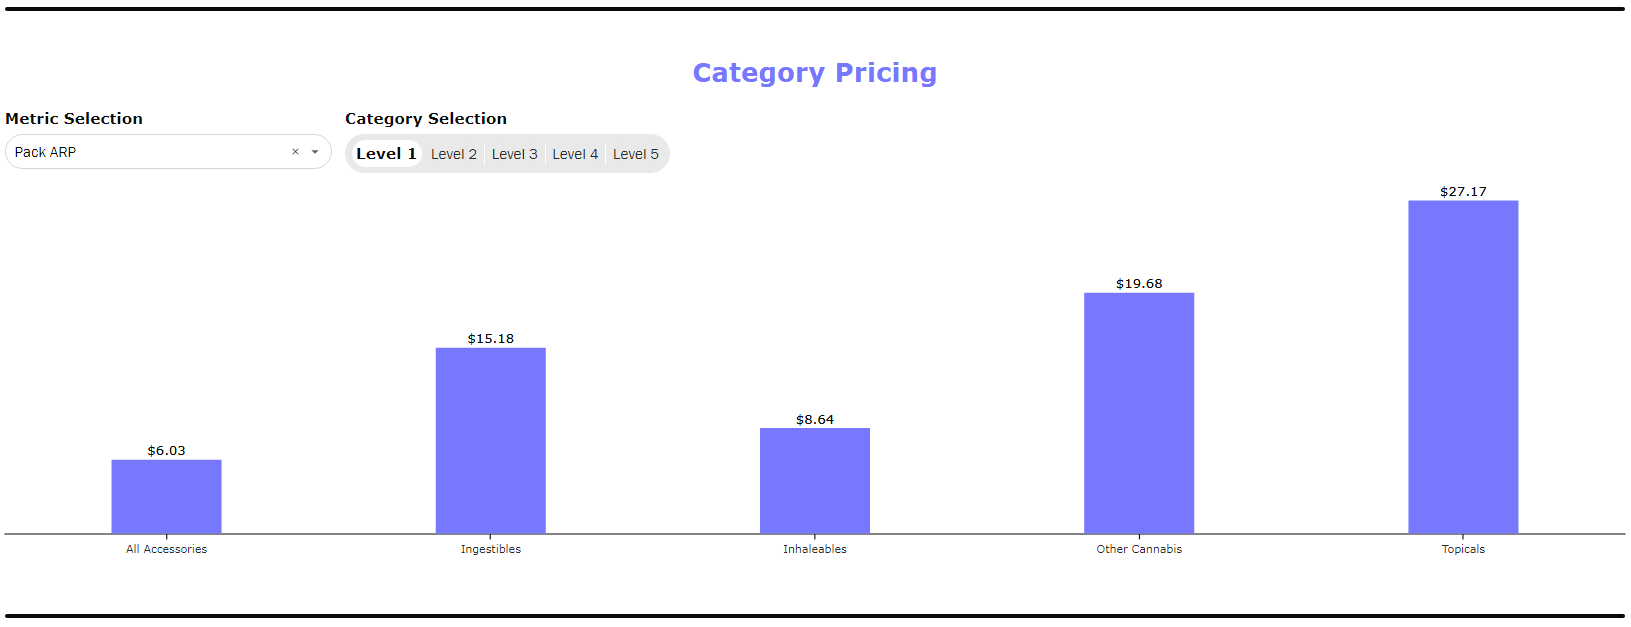
Compare average prices across categories from category levels 1-5.
1. If desired, use the filter panel to narrow down to a single category.
2. Setting the category selection at the top of this comparison of the subcategories within the main category selected. The higher the level number will provide a more granularly subcategory view.
- Ex: use the filter panel to filter category level 3 to dabbable concentrates and change the visual to level 4 to compare different dabbable concentrate format prices.
Brand Overview
Provides an overview of how the broad brand landscape is evolving.
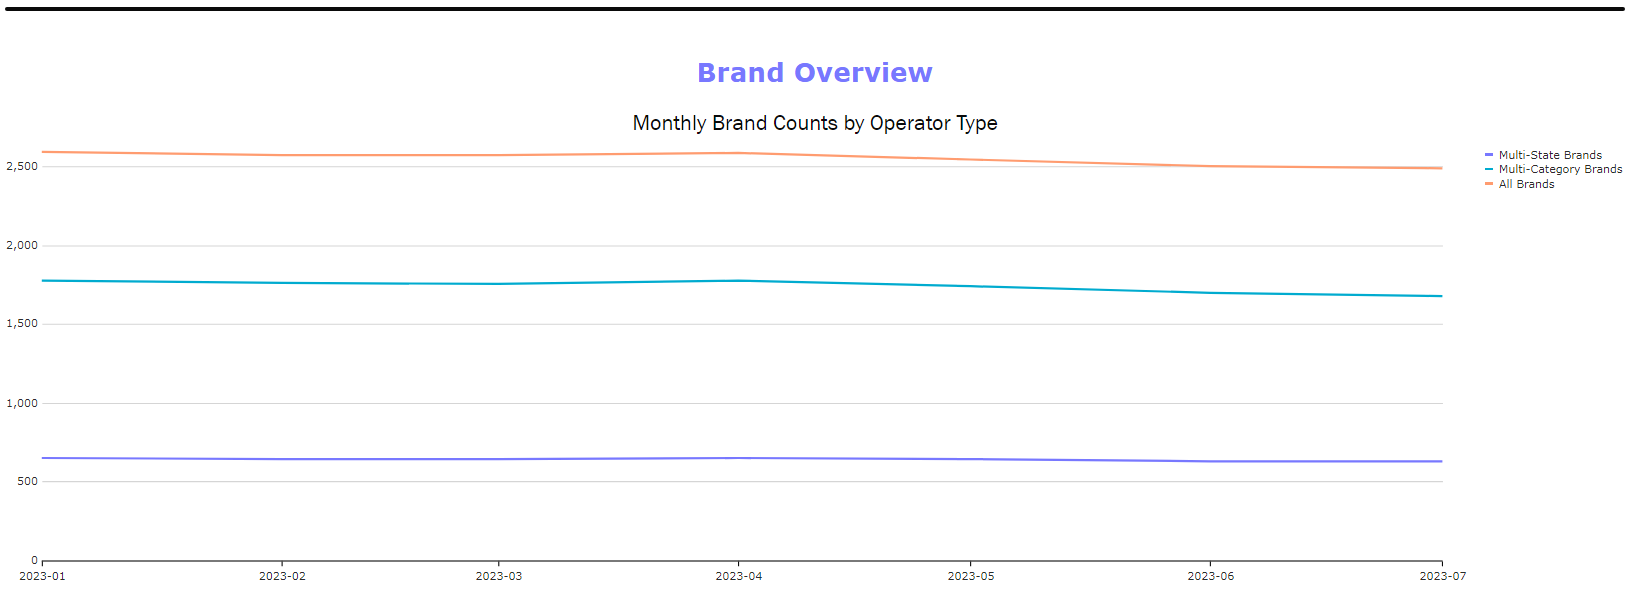
Follow the trend for the total number of brands and the makeup of multi-state and multi-category brands. This visual helps set the context for brand strategy, especially utilizing the filters to drill into specific categories and markets.
- Multi-state brands are any brands that have sales in more than one state.
- Multi-category brands are any brands with sales in more than one level 2 category.
- Calculation is limited to the categories and markets you are subscribed to.
- Ex: if you are only subscribed to one market, multi-state brands would be 0.
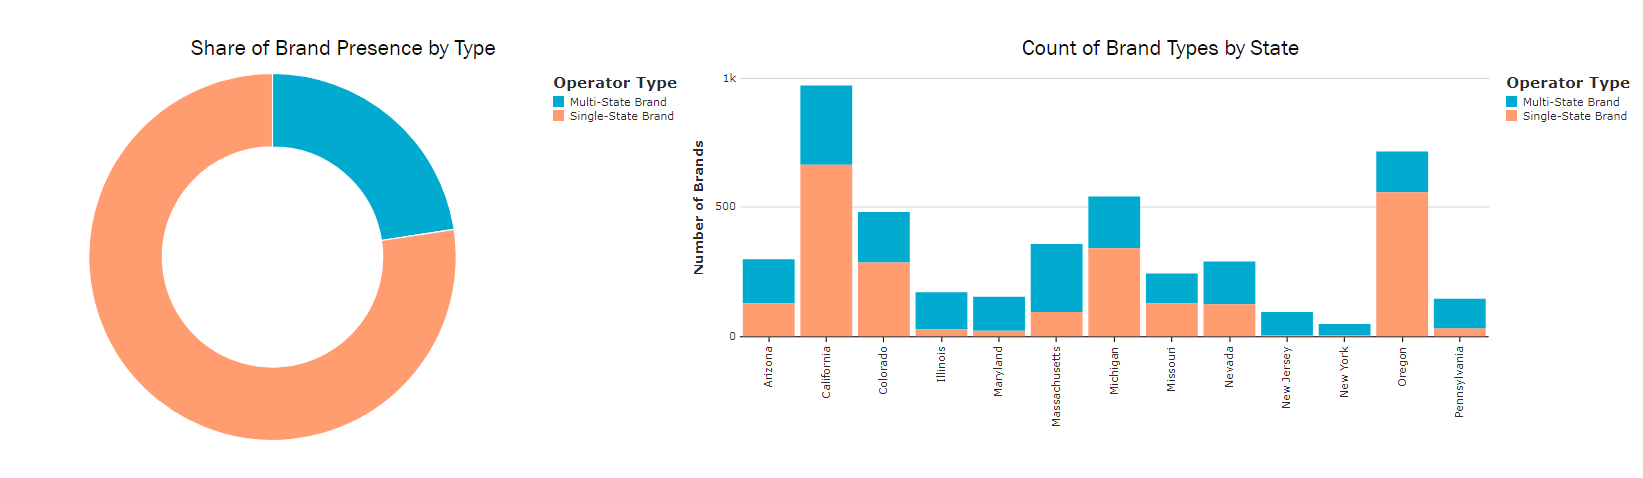
Filtering a single category will remove multi-category brands. Filtering to a single state will remove multi-state brands.
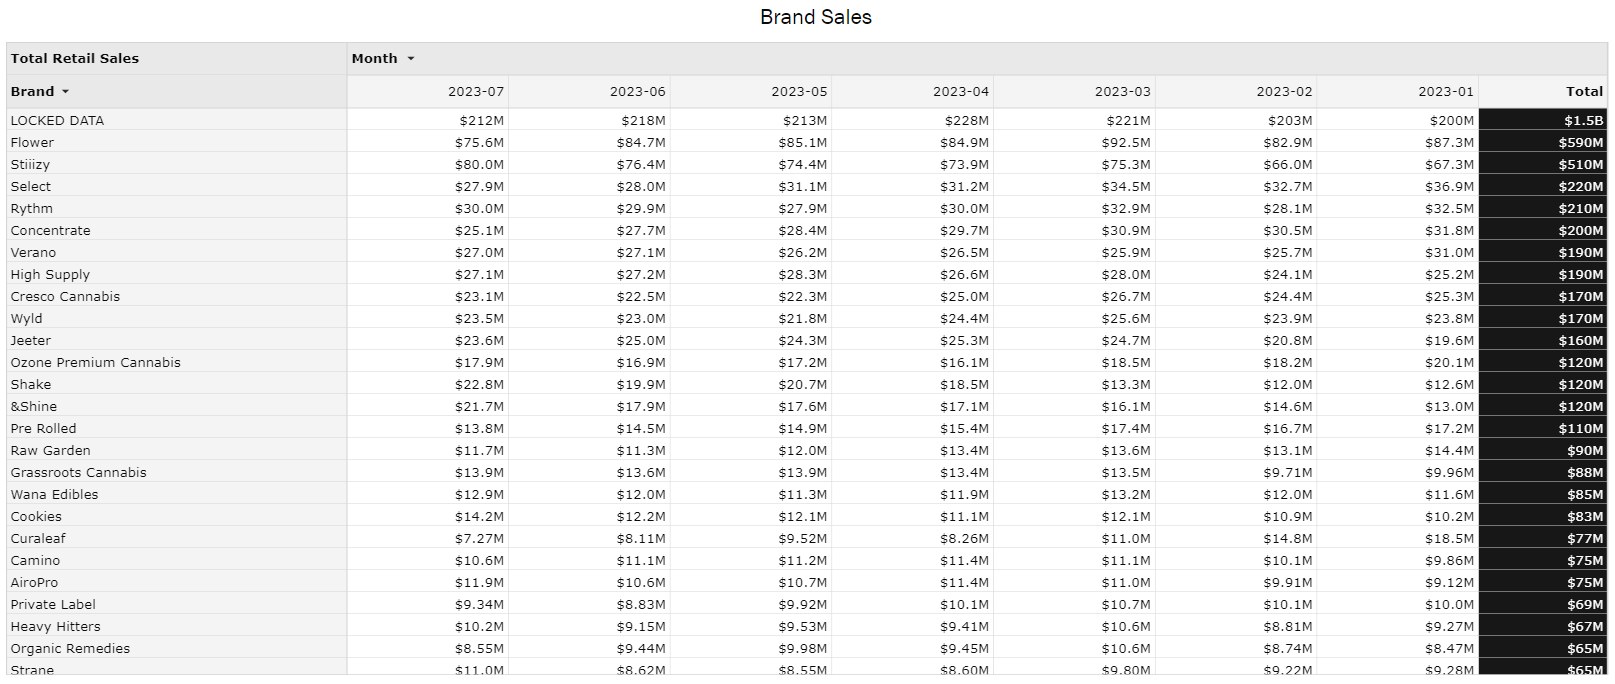
The Brand Sales table view will provide the total monthly retail sales for all brands in the BDSA dataset over a selected period.