Table Of Contents
About
BDSA’s Menu Analytics dashboards combine the depth and breadth of our Retail Sales Tracking data with new insights on product availability to give the user a comprehensive and granular set of metrics covering distribution, inventory, and velocity for brands and products.
Use Cases
- For Retailers
- Use velocity to rank brands and products by how effective they are in store.
- Compare product performance, pricing, and markup in your location compared to
local competitors.
- For Manufacturers/Brands
- Competitive analysis across key velocity and distribution metrics.
- Track your brand's performance across states, counties, or localities.
- Compare the listed price for your brand/products and competitors'
brands/products across different locations and markets.
Dashboards
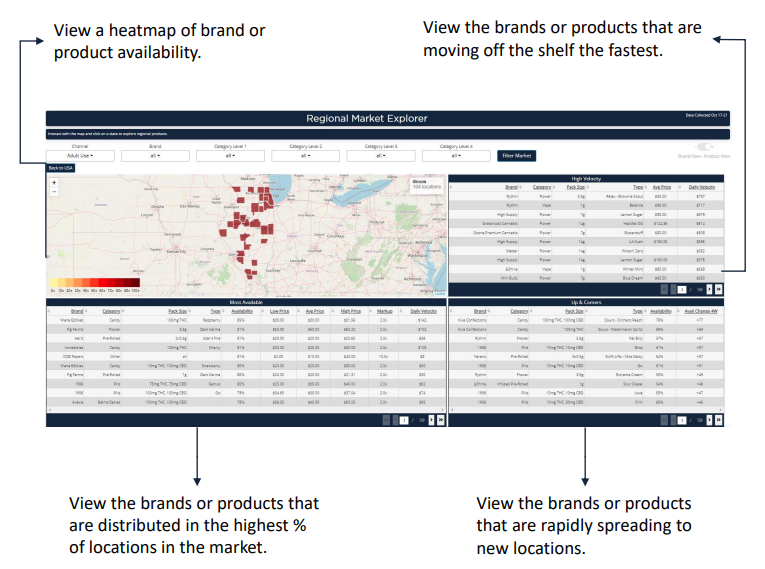
Regional Market Explorer
- Evaluate a brand or product's sales effectiveness from shelf to basket
Click here to learn more about the Regional Market Explorer!
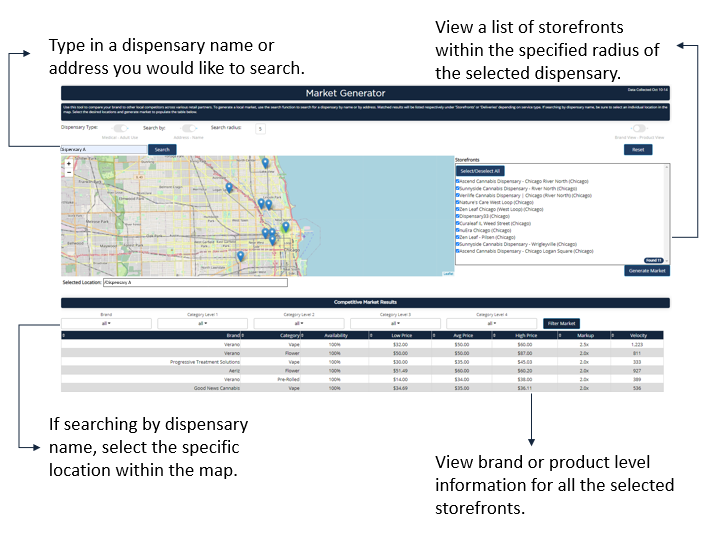
Market Generator
- Compare your dispensary to other local competitors
Click here to learn more about the Market Generator!
Inventory Tracker
- Check on a brand or product's inventory level across locations
