Table of Contents
Key Questions Answered
- How does pricing for the same category vary across my stores?
- Is there a relationship between total sales and ARP?
- What price band generates the largest sales?
- What influence does price have on if a product is a top or bottom ranked product in my assortment?
Snapshot
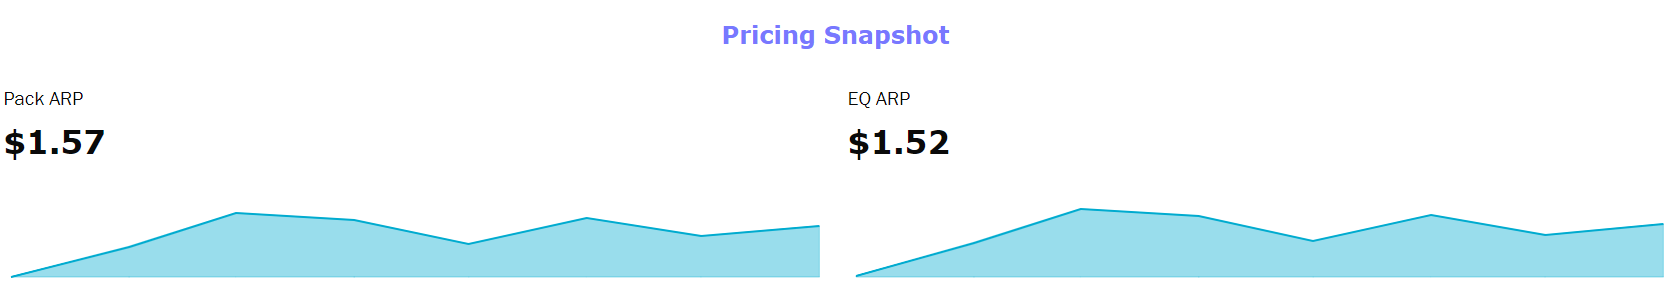
Follow total point in time, as well as trending price changes.
- Hover over the line chart to see month to month price comparisons

Pricing by Location
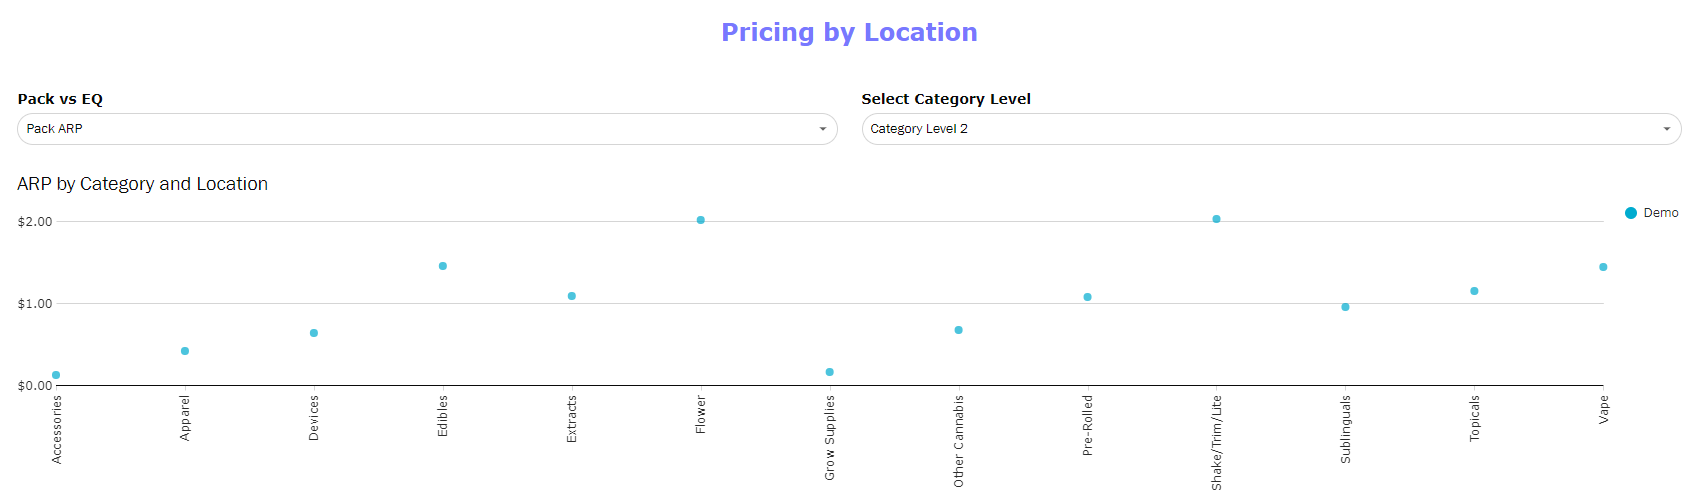
View pricing across categories and all locations to see which locations are offering more premium or value prices for the same category
- Screenshot is representative of demo data. For multiple locations under a management, each location will be represented by a dot and listed on the right hand side.
Note: for understanding pricing vs the total market, use the My Store Benchmark dashboard
Pricing Trended
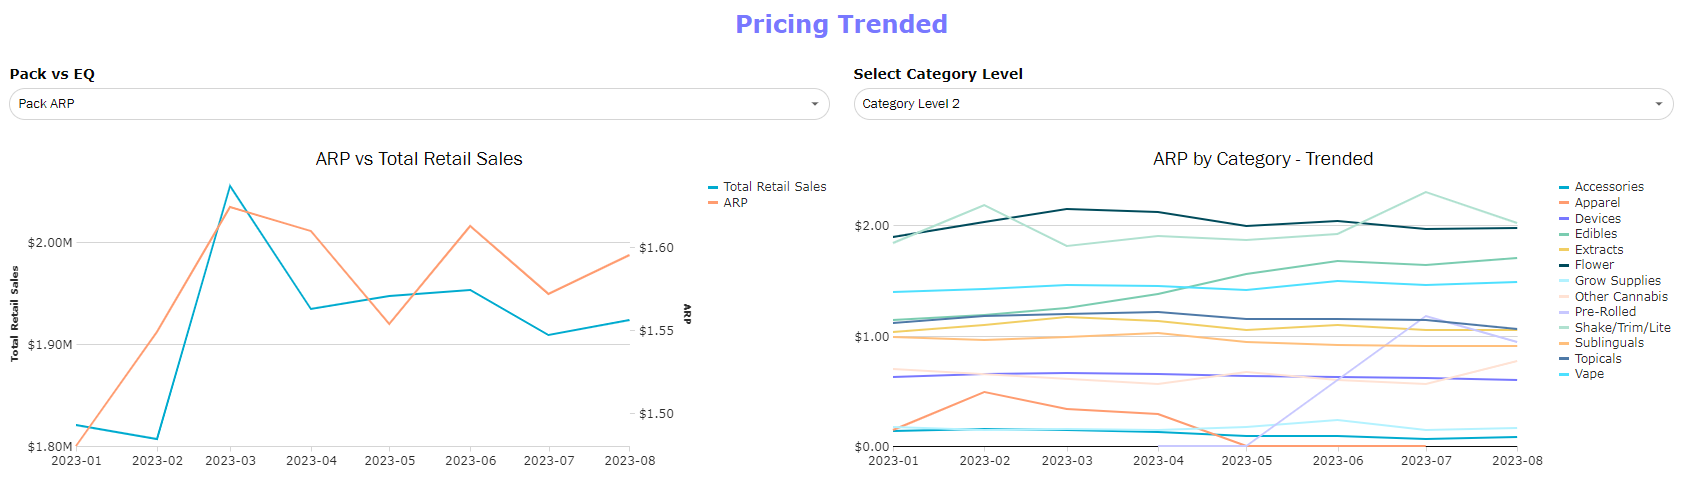
Follow the relationship between price and total sales volume. Additionally, track total ARP changes across different categories.
Price Increments
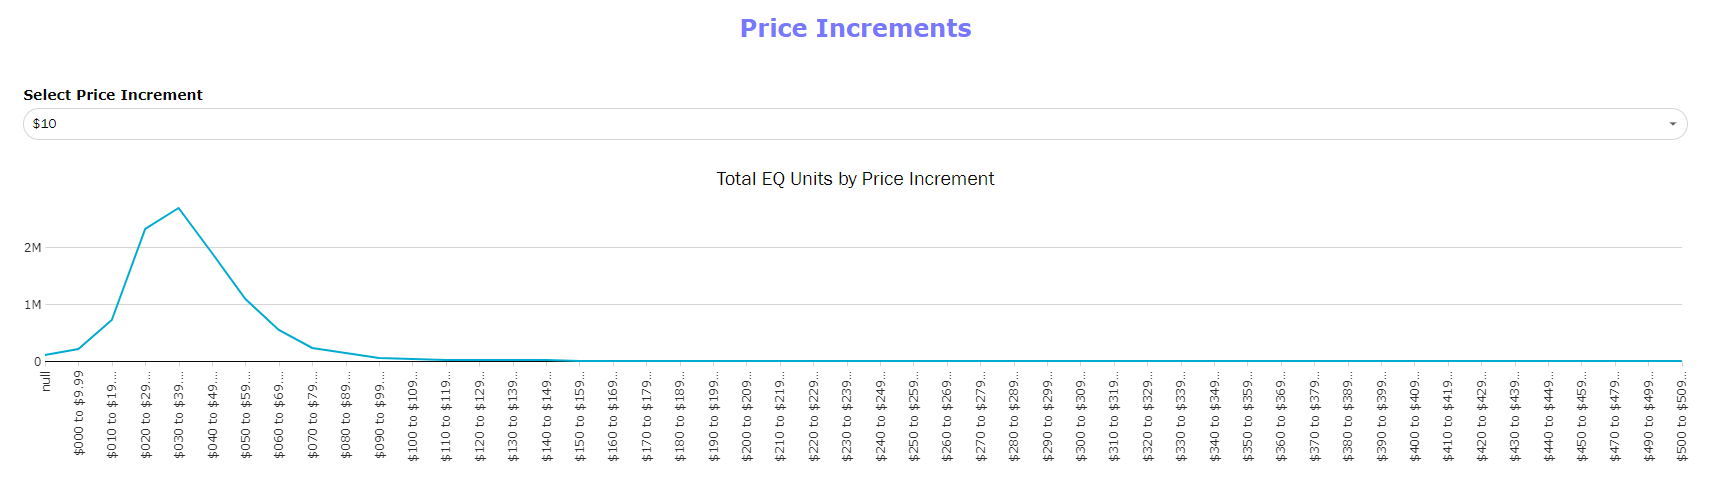
Build on understanding the relationship between SRP and retail sales by finding the price band that gas the highest number of sales.
- Use the drop down to select how wide the desired increments should be.
- Works best when specified to a specific category or brand for more actionable insights.
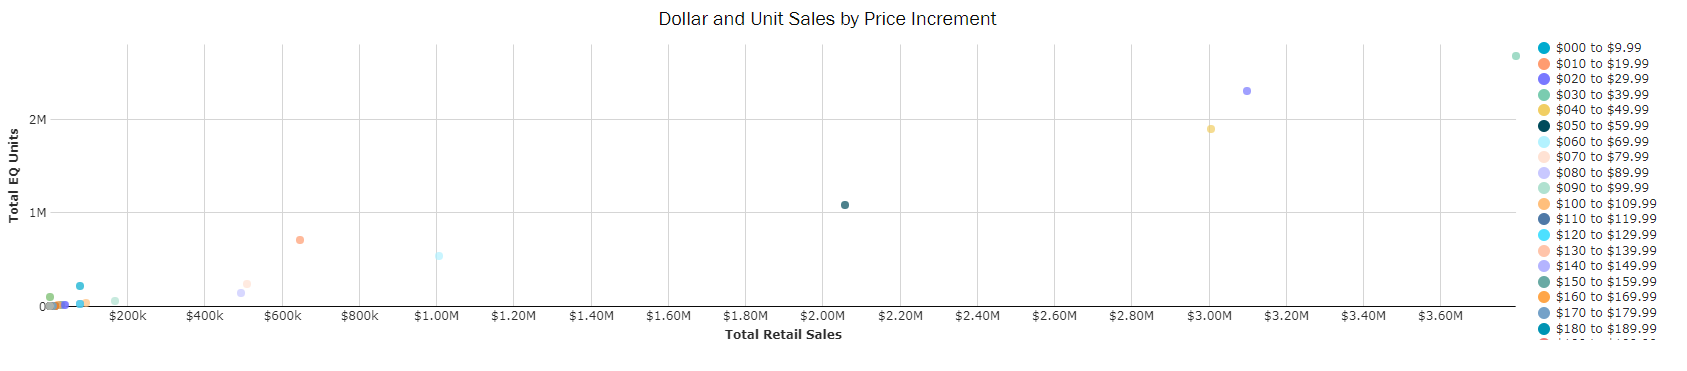
- Cross reference most sales volume with unit volume to optimize where discounting is generating enough units to offset the discount, or where there are opportunities to increase price and generate more total sales with less units.
Pricing - Top Products
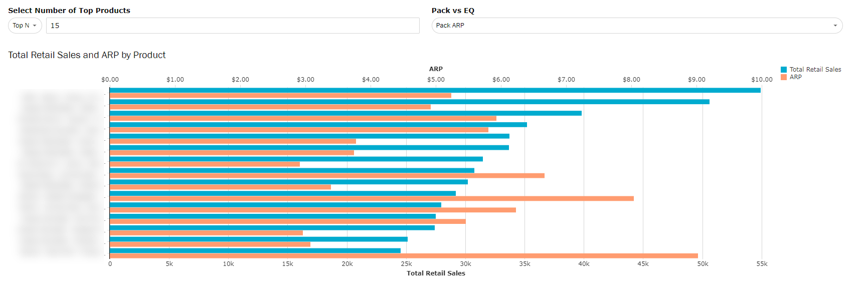
Compare pricing across the top products in your assortment to track.
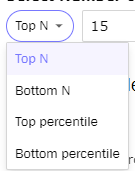
- Use the "Top N" drop down to do a comparison with the bottom ranked products to see if there's a relationship between price and ranking