Table of Contents
Key Questions Answered
Snapshot
Retailer vs Market - Trending
Retailer vs Market Assortment
Retailer vs Market Top Brands & Products
Key Questions Answered
- What is my managements share of the market?
- Are my locations growing in revenue faster or slower than the market?
- How are my products priced vs the market?
- What are the highest selling brand and products in the market? How does that compare to my highest selling brands and products?
- I'm looking to expand product offerings in a certain category. What is trending in the market that I don't currently have on my shelves?
Snapshot
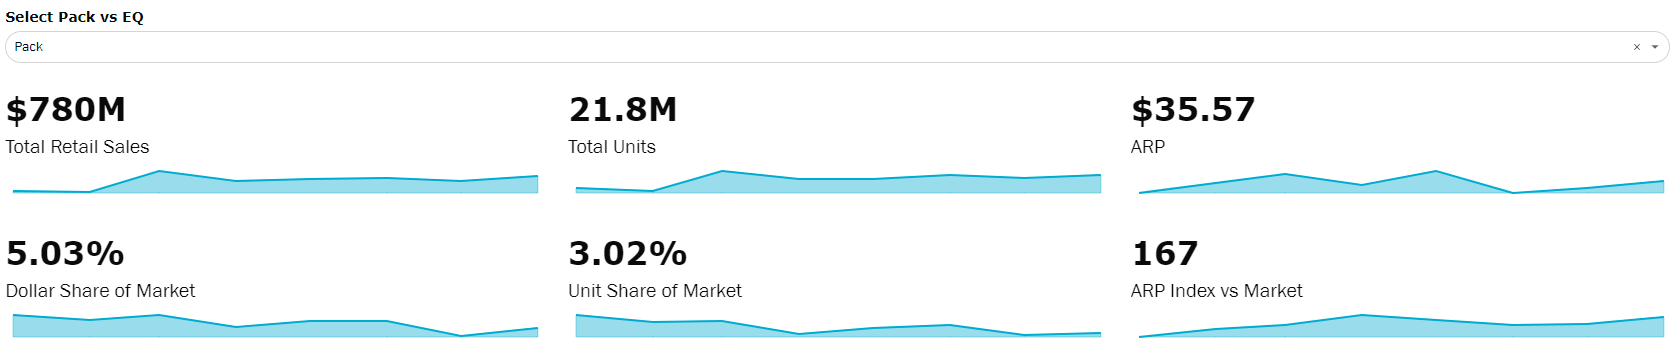
Snapshot across the top is reflective of the selected management or location.
- The second row is the comparison of the top rows to the total market tracking retailer share and ARP index
- Indexing is price relative to market, based in the value +- percentage points from 100
- For example, an ARP index of 167 means that the retailers ARP is 67% higher than the market average.
- An ARP index of 95 means the retailers ARP is 5% less than the market average.
- An ARP index of 100 means the retailers ARP is exactly the same as the market average.
- This works best when looking at a specific category or brand for the most actionable insights
Note: If you have locations in multiple states, be sure to filter to a single state to get the most accurate comparison of share.
Retailer vs Market - Trending
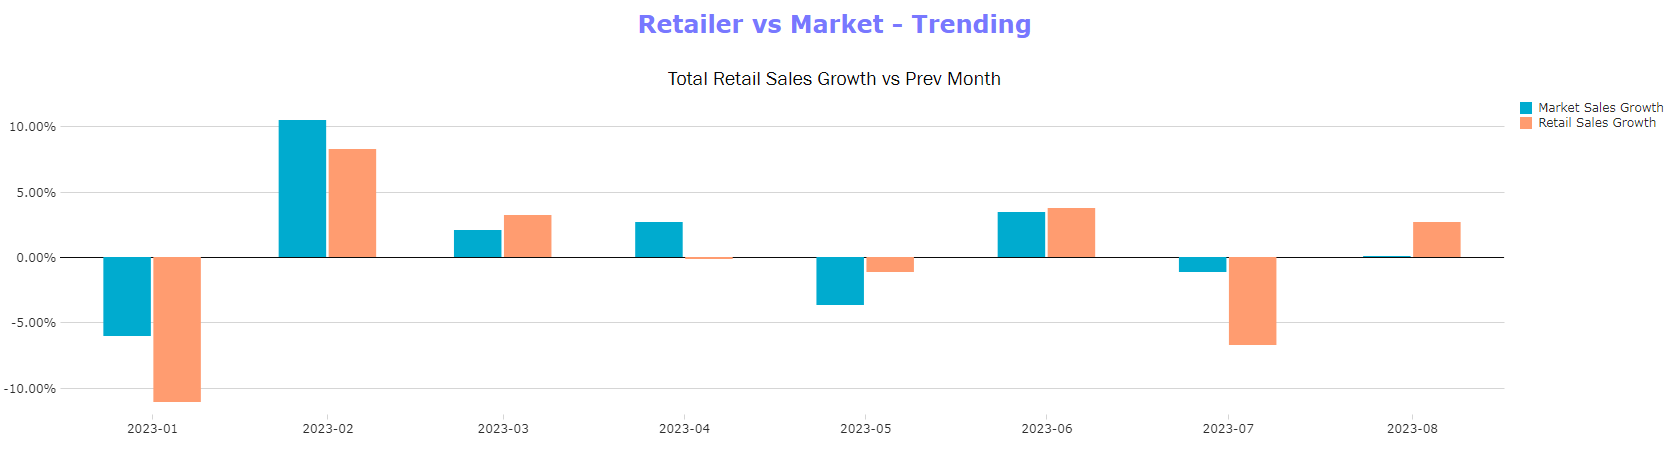
Follow month to month growth and decline of a management vs the market.
- Helps to track if sales changes in a specific management or location is being driven from overall market changes or is unique to the management
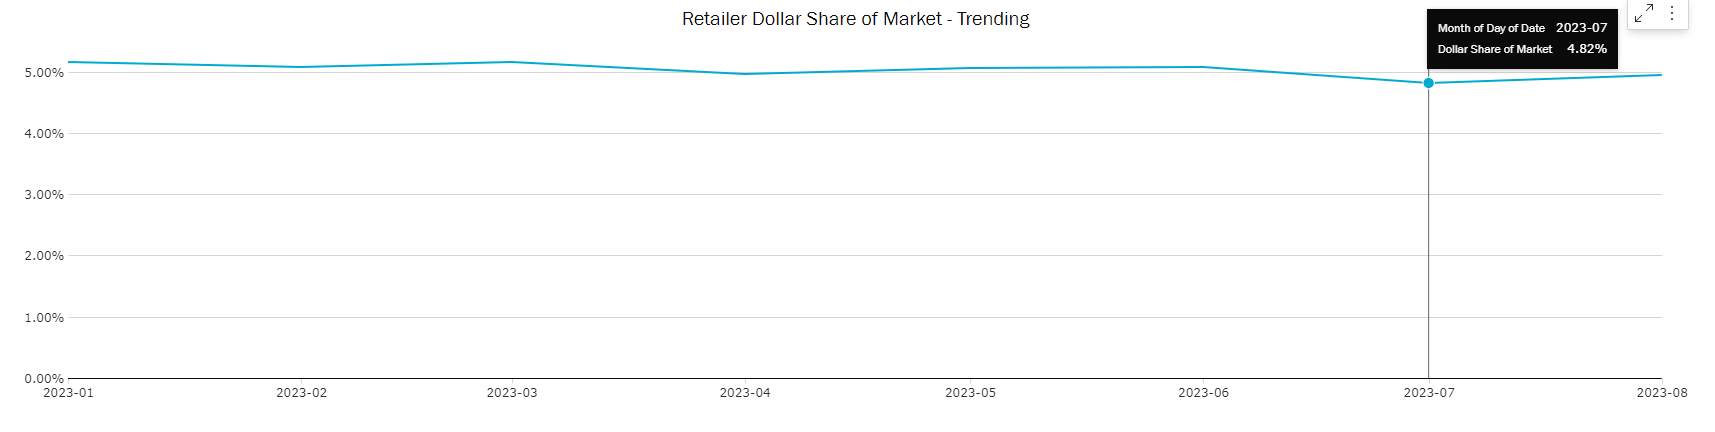
Track overall share of the market at a management or location level.
- If expanding locations under a management, track how the expansion impacts the managements total share of market
- Filter to a specific location to see how marketing and promotional efforts impact the location's share
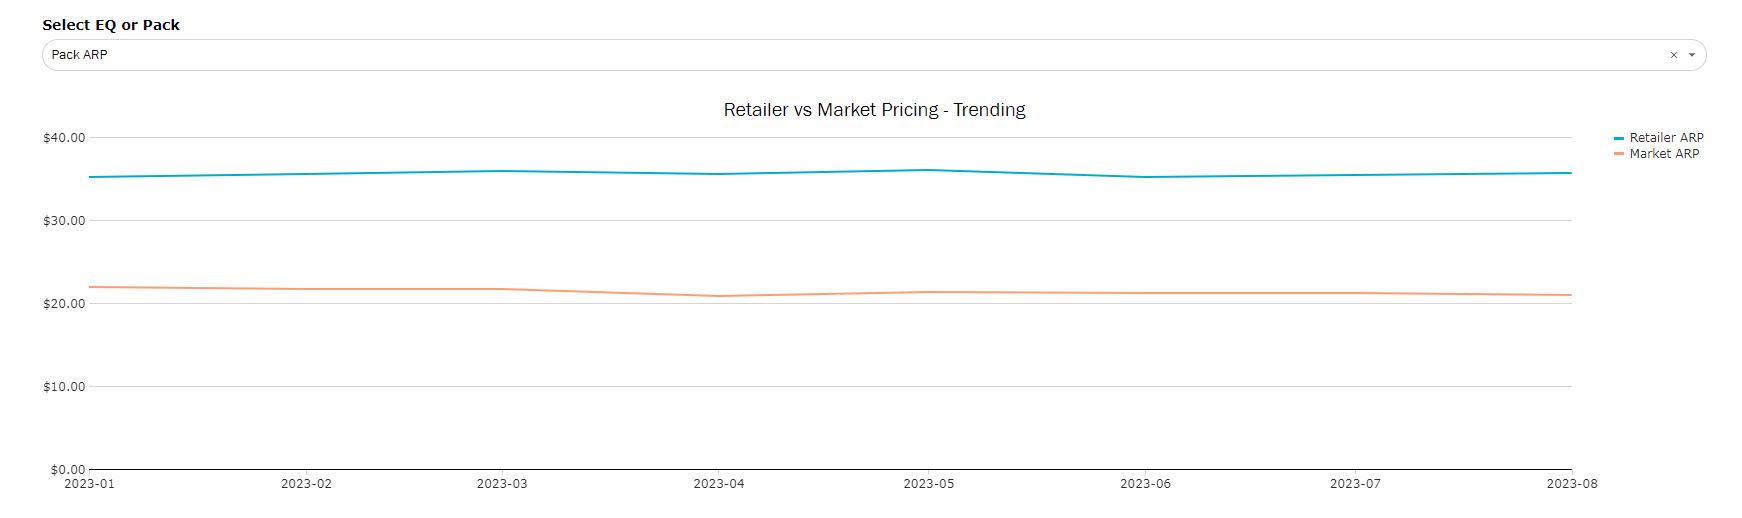
Follow pricing trends within your stores vs the market.
- Most useful when filtered more granularly, like to a specific category or brand.
Retailer vs Market Assortment
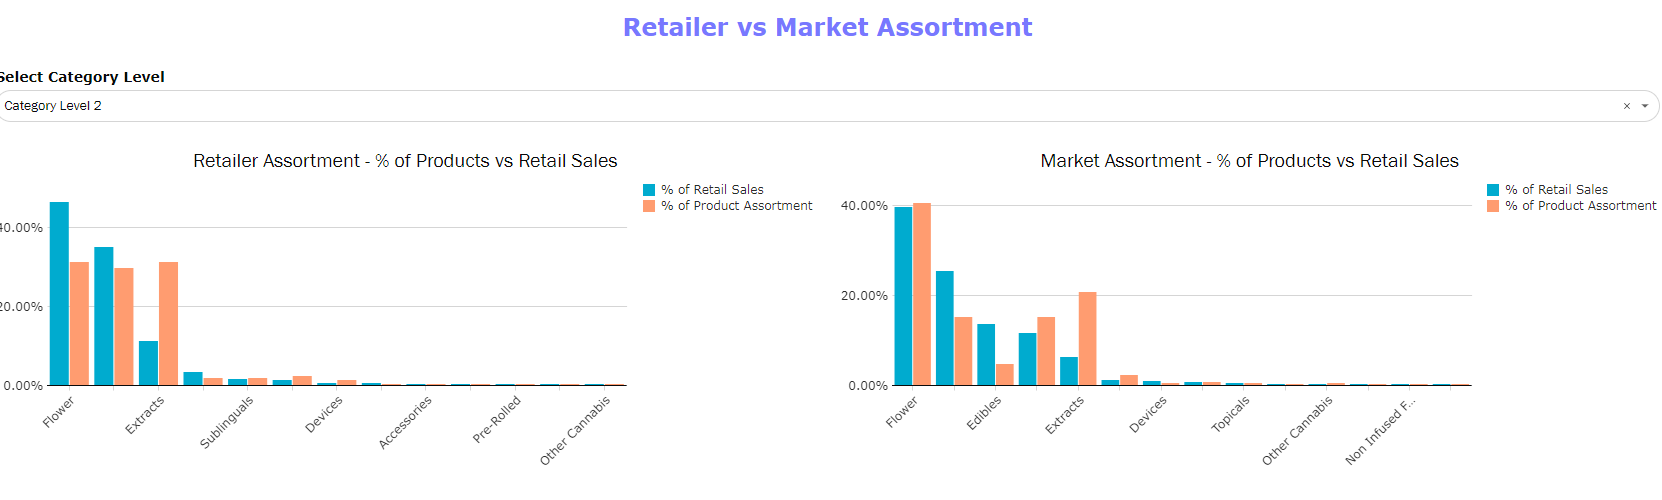
Compare overall category % of retail sales and % of products in a management vs the market.
- Helps identify internally if there's an oversupply of a certain category that isn't generating enough sales, as well as being able to compare successes in a certain category vs market trends.
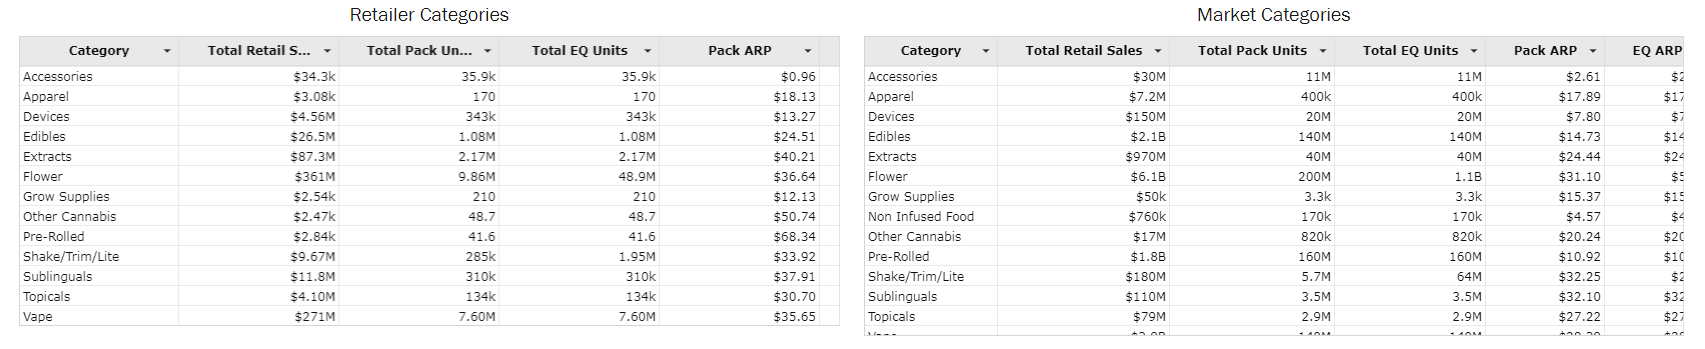
Get more granular insights of sales, units, and price at a category level comparison.
Retailer vs Market Top Brands and Products
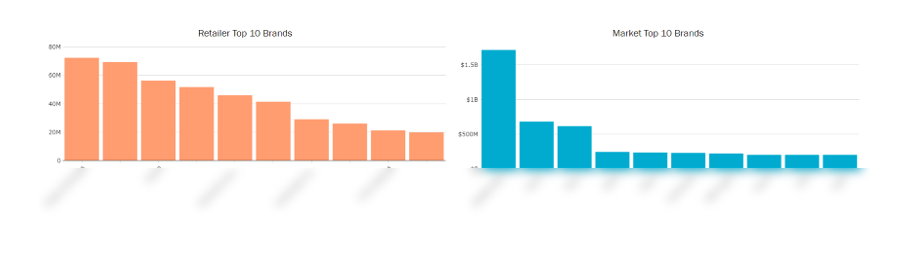
Compare top performing brands in a management vs the market
- Identify opportunities of popular brands that can be added to a store's assortment
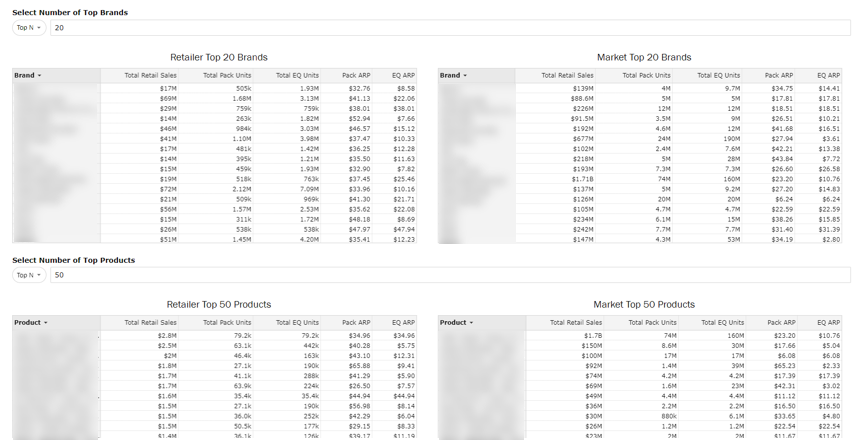
Look at additional KPIs and a customized list using the top brands and products tables
- Defaulted to 20 and 50, but can be increased
- Additionally can assess lower performing brands and products in your assortment compared to that of the total market to see if performance is unique to your store or a growing trend.