Table of Contents
Key Questions Answered
Snapshot
Category Details
Sales Details
Key Questions Answered
- How are my locations performing against each other?
- How have my total sales changed overtime?
- What categories in my assortment are gaining or losing sales?
- As I run promotions, how is that affecting total retail sales?
- What are my top performing brands and products?
Snapshot
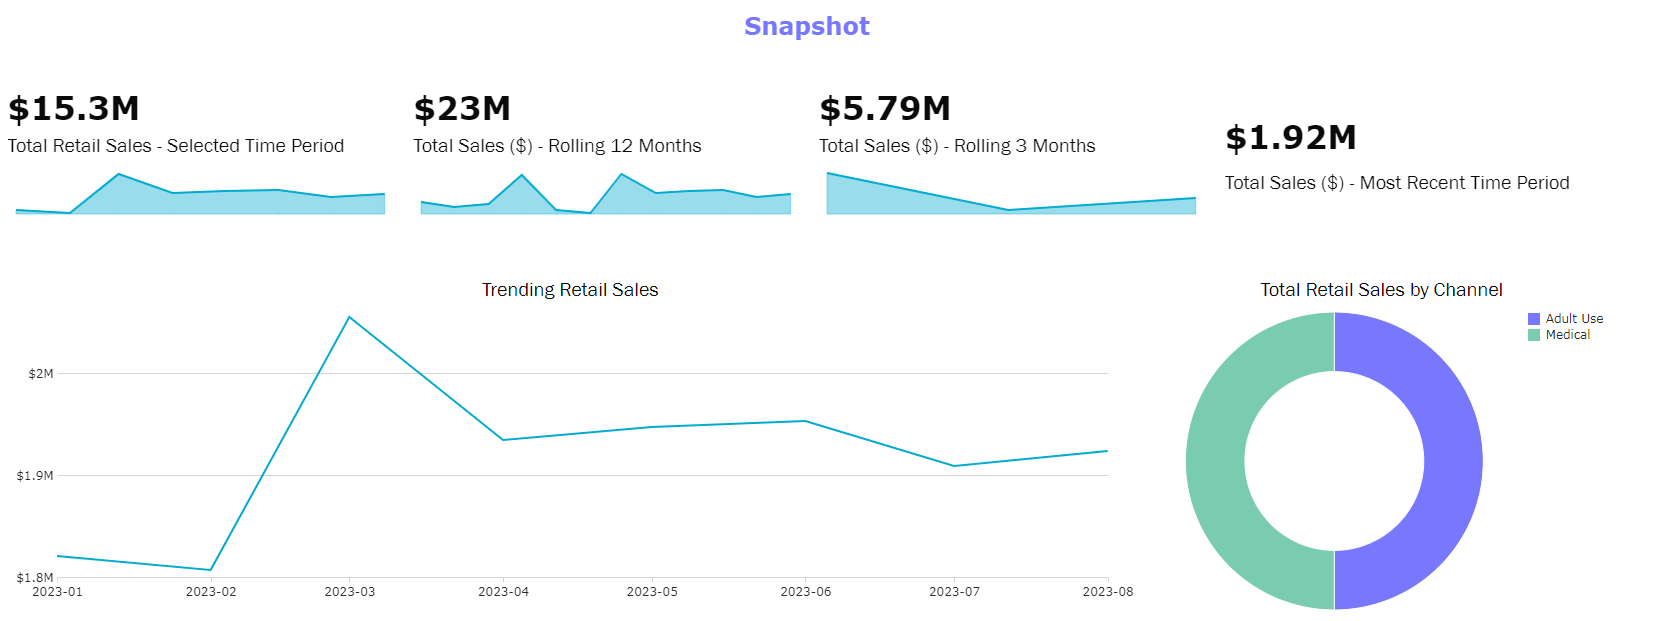
View point in time and custom trending visuals of overall management sales performance, including breakdown of sales contribution to adult use vs medical markets.
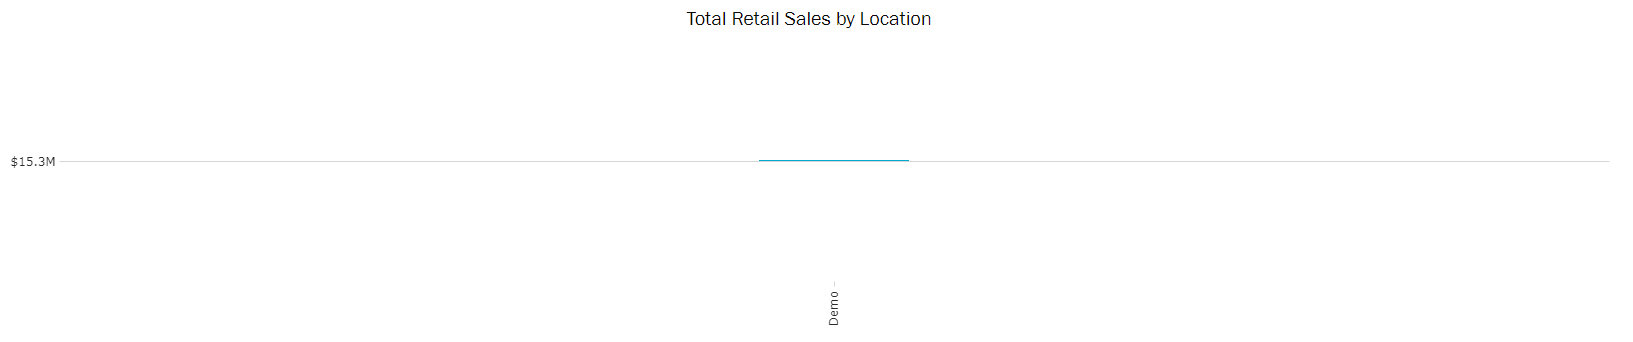
Compare total sales performance across locations
- Demo environment shown here. X-Axis will reflect all retail locations if there are multiple.
Category Details
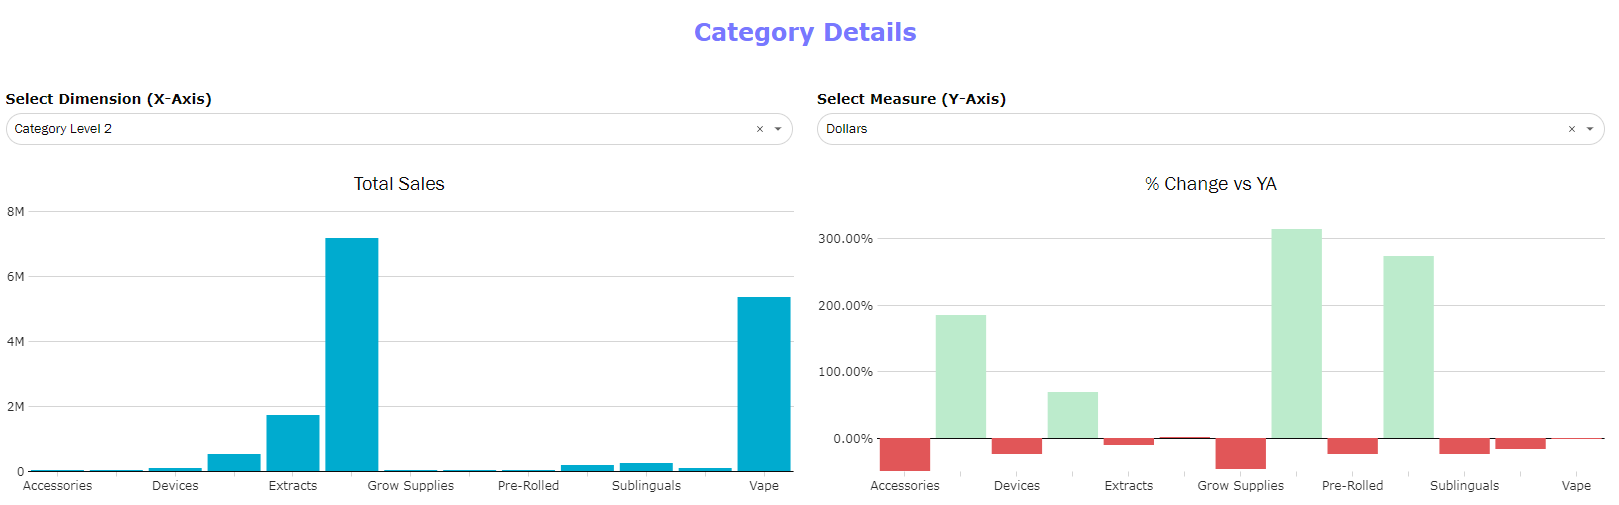
Compare total measure sales (chosen by the selected drop down) compared to the category's change vs a year ago.
- Helps to identify performance trend changes as store assortment changes.
Sales Details
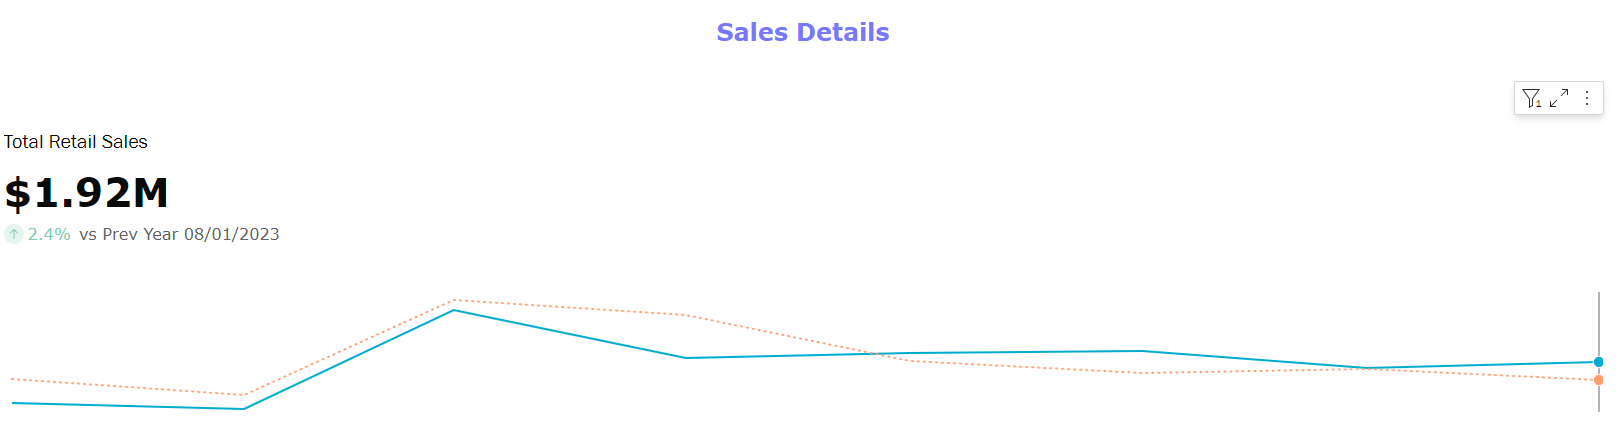
Track sales changes vs performance the previous year.
- Blue line is current year sales, orange line is previous year sales.
- Hover over the line to populate the % change vs previous year.
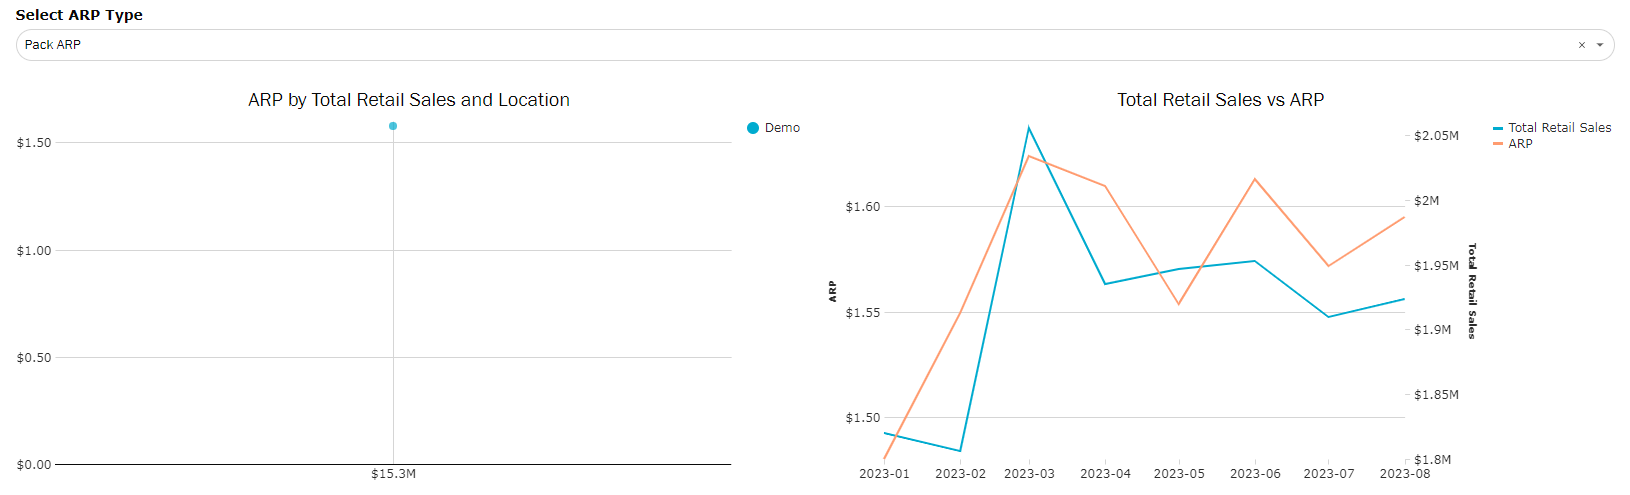
Track where each location falls between ARP and total retail sales using the scatter plot, as well at the trending relationship overall using the line chart.
- Tracks if higher or lower ARP locations impact total retail sales.
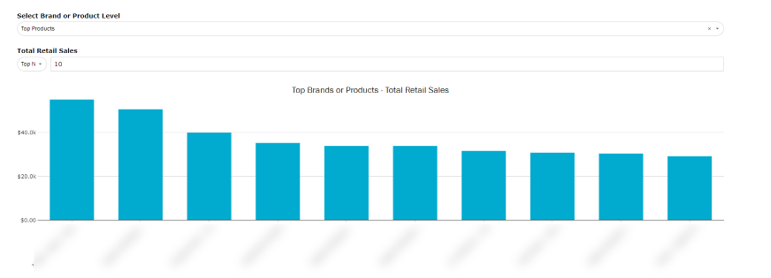
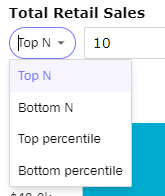
Choose between populating top brand or products using the drop down, as well at the total number populated.
- Additional option to track the worst performing brands and products to identify where assortment changes may want to be made.