Table of Contents
Key Questions Answered
- Is a brand selling more products in a certain price tier compared the the average brand in the market?
- What pack size contributes the most sales to a brand and at what price strategy?
- How does a brand's price strategy change across markets and categories?
- Is a brand's product assortment pricing aligned with the price strategy that sells the most?
Note: we recommend filtering to a specific brand to get the best use of all visuals in this dashboard.
Brand Overview
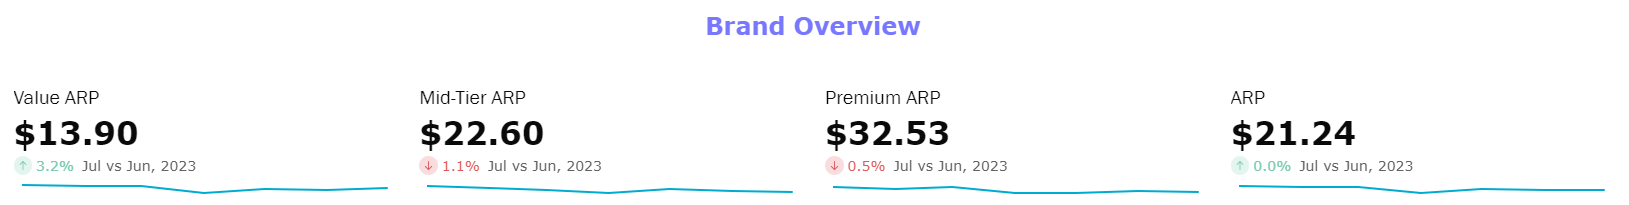
Use the snapshots across to the top to see the ARP by tier for the most recent month selected in the date filter and how it has changes from the previous month.
- Pricing across tiers follows the same pricing methodology as other Retailer Sales Tracking dashboards - post discount, pre-tax.

The sliding bars across the bottom of the visual are price trends, so hovering the mouse over a spot will change the displayed ARP value and it's % change from the previous month.
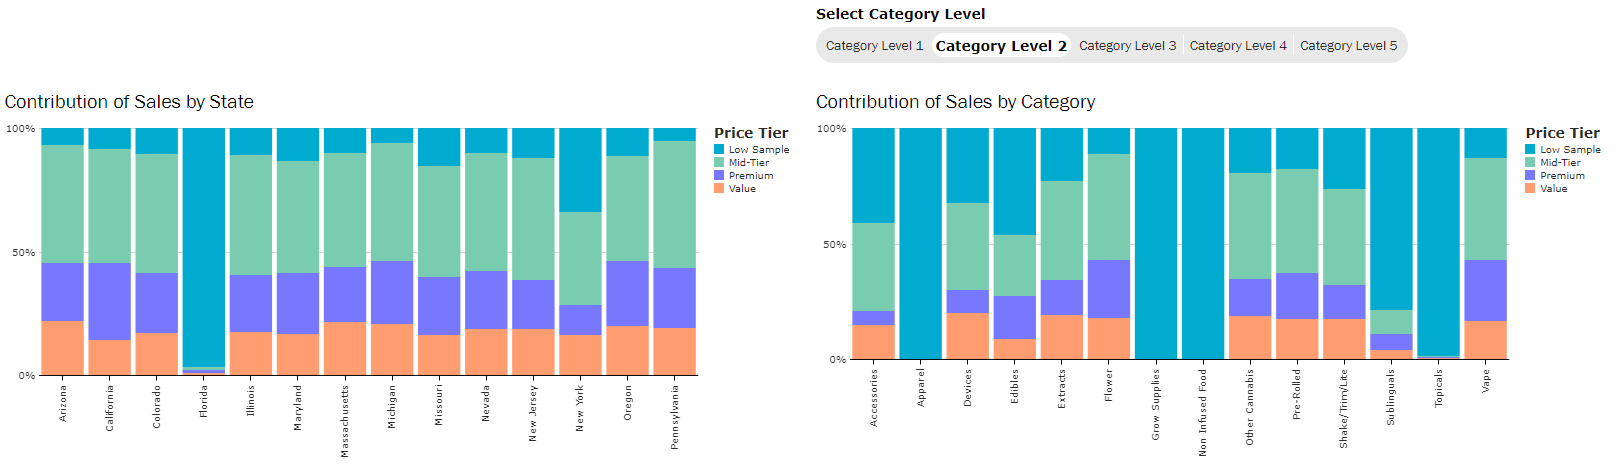
Compare a brand's sales by price tier across states that it's selling in.
- Use to understand how a brand's strategy may be different based on the state
- Can use as context if a brand differs state to state and then leverage the Price Tier Overview dashboard for market context if trying to align tier strategy.
Compare a brand's sales by price tier across categories that it's selling in.
- Drill down category levels to gain better understanding of how sales distribution changes by price tier.
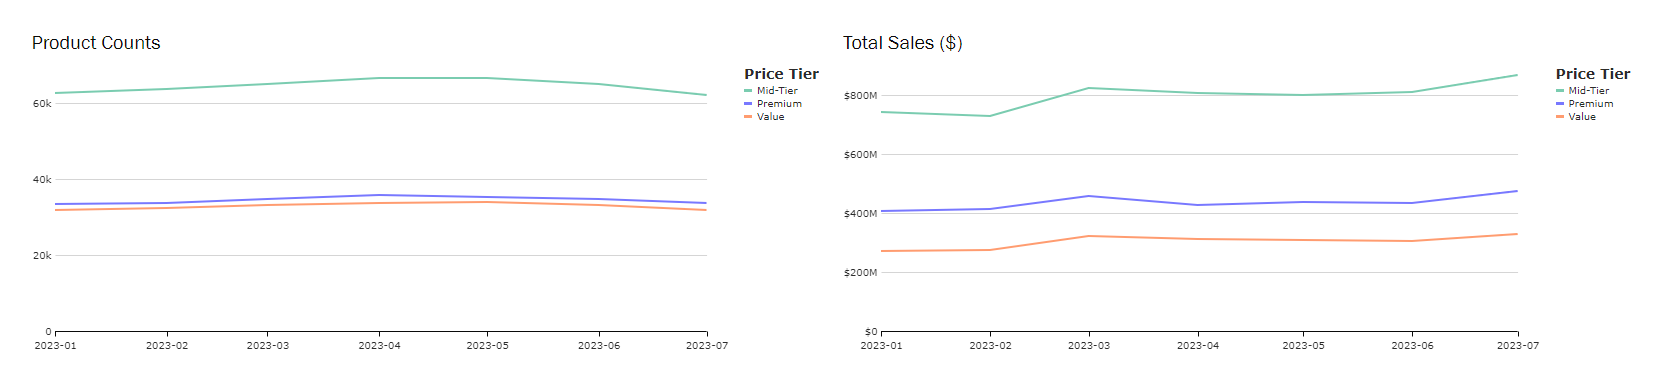
Follow a brand's product assortment and sales by price tier
- In the above example, the brand's product assortment trend aligns closely with the trend in sales by tier
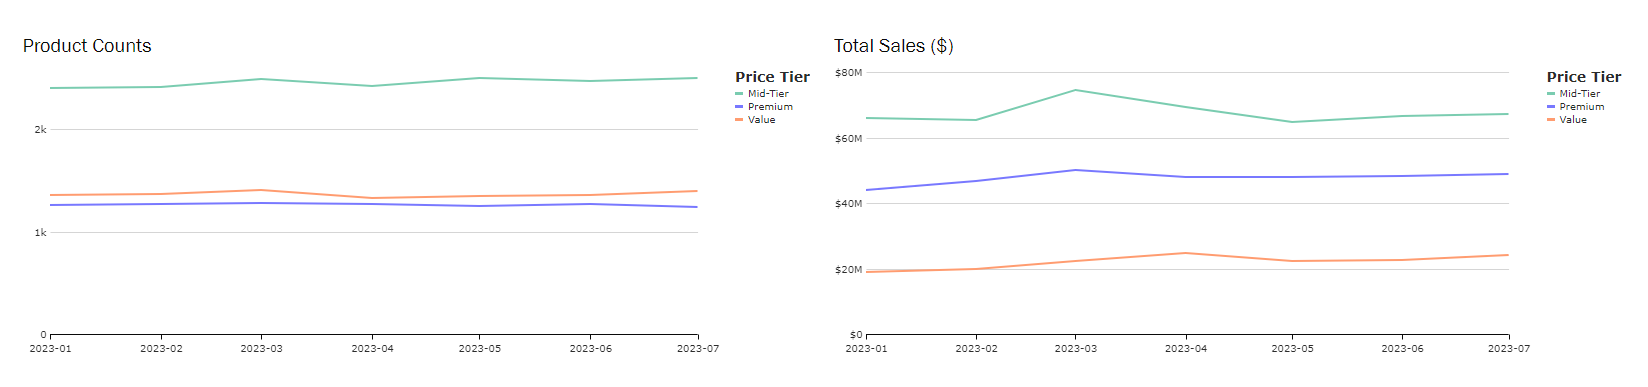
- In this example, the brand is gaining more sales from premium products compared to it's share of products, which might indicate that they should start bringing up the price of some of their value products because mid-tier and premium are a much larger share of their sales.
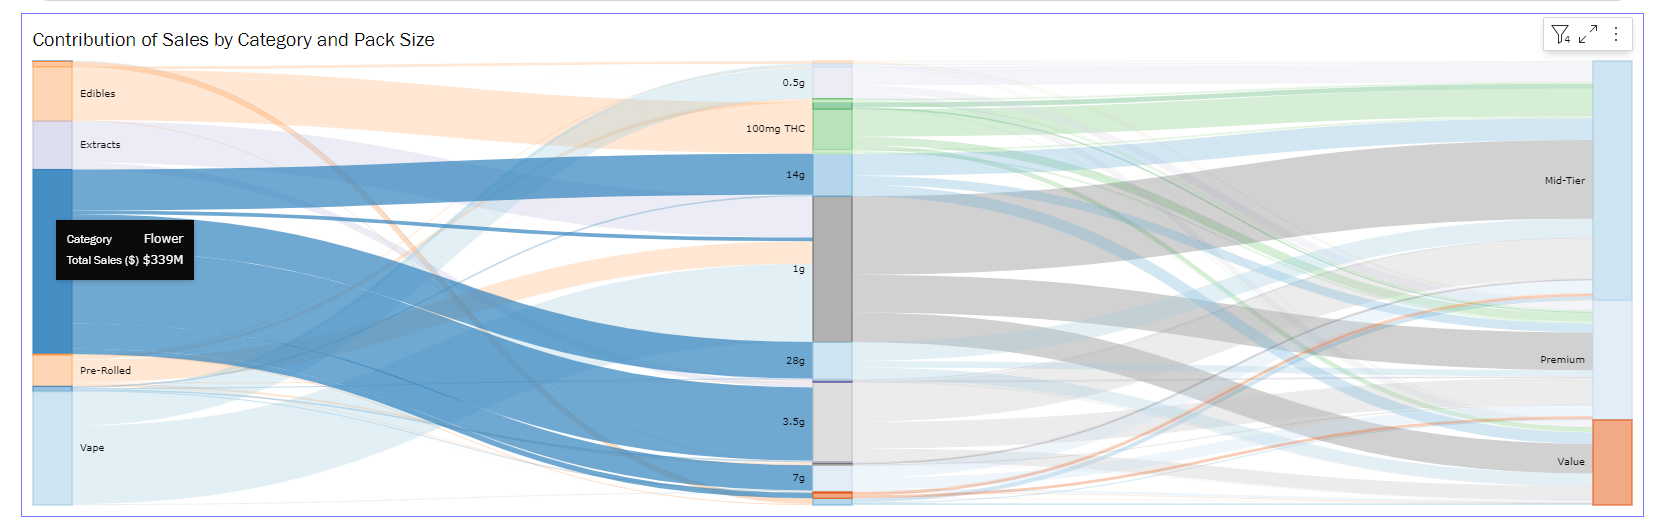
Compare the total size of each pack size by category that the brand sells
Interact by hovering over a value and following the color to see how that share of sales breaks at each level
- For example, I can see Flower total sales for this brand are $339M
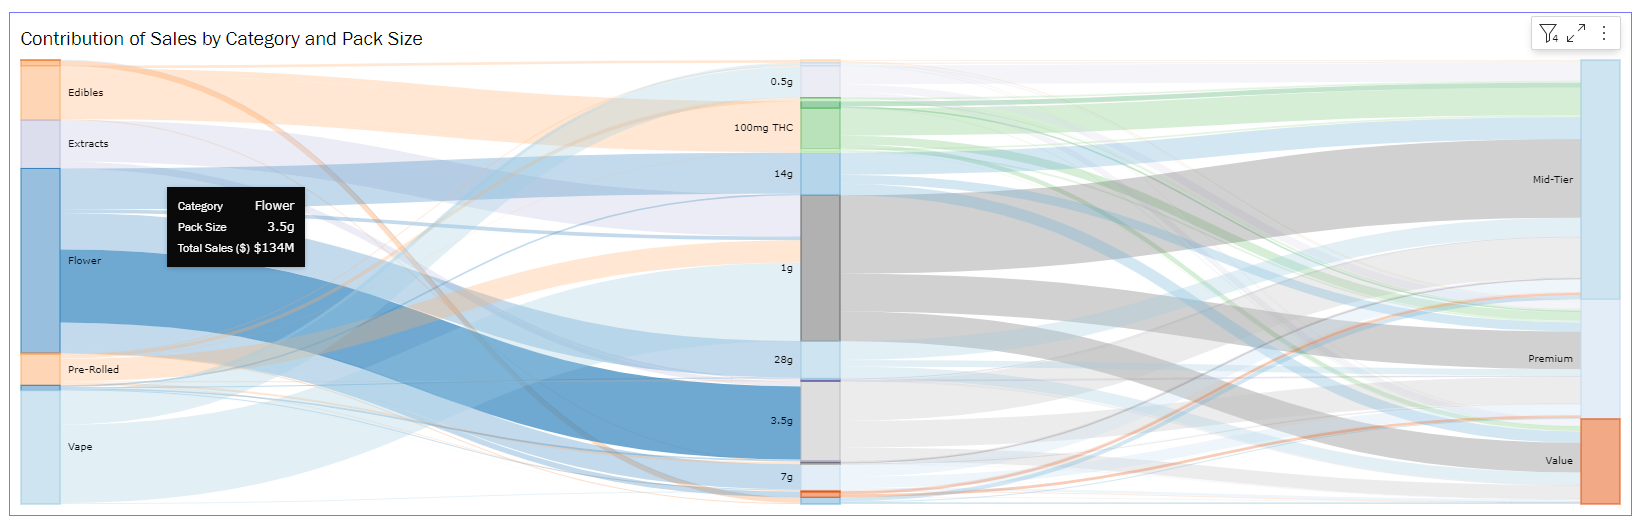
- I can now hover of a single line from that and see the volume of Flower sales going to each pack size, and then continue over and see the volume of that category and pack size to each tier.
- Gain context of share of sales by price tier within each category and pack size
- Provides insight into both total category share as well as what the tier breakdown is for the top selling pack sizes for the brand
- For example, for the above brand, Premium and Mid-Tier take up the majority of sales for top selling categories and pack sizes. This would indicate that the brand may want to look into which SKUs are falling into value and try to bring up the average price.
- Due to the amount of data flowing through this visual, we recommend filtering to get the most impactful information.
Price Tier Brand Evaluation
Use these visuals as a benchmark against the market or a competitor
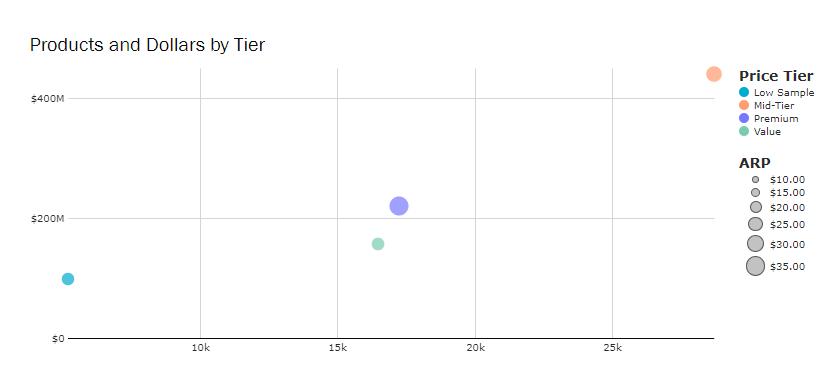
Use the scatterplot to to compare what price tier the majority of products and sales fall in.
- In the above example, the number of total value SKUs is close to the number of total premium SKUs, but there are more than 4x sales for premium products, so this may warrant investigation into what the value products are and if there's an opportunity to increase prices.
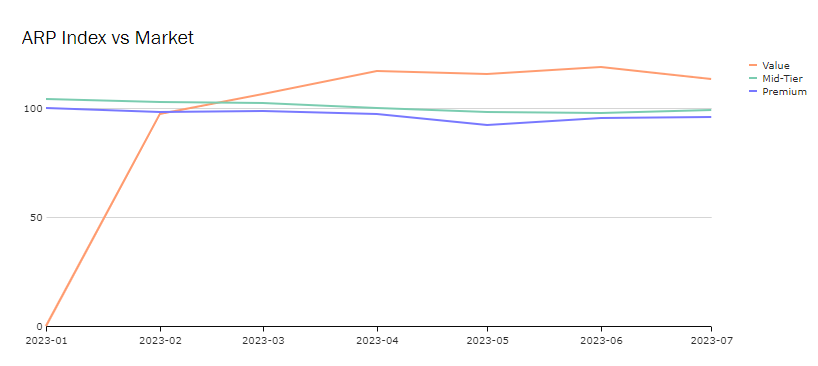
Use the Brand ARP index to understand how a brand's pricing compares to other products within the same price tier.
- Brand's ARP Index vs Market measures the % above or below the market average by price tier in in form of an index. For example, an index of 105 for mid-tiers means the selected brand's mid-tier products are 5% higher than the market average. An index of 95 would mean the brand is price 5% lower than other mid-tier products in the market.
- In the above example, the brand's premium & mid-tier products have become more affordable vs other product sin the same tier. This could be both because of the market increasing prices for this specific category and pack size and the brand staying the same, or the brand has been discounting and may be trying to align closer to their value pricing.
- Brands can leverage this to optimize where they want to be in the market
- A brand may see themselves as very premium due to certain attributes, efficacy, and their brand status, so they be more inclined to align slightly above the average premium products. Alternatively, a brand might be includes to be more aggressive on pricing, so they may want to align on the lower end of value.
- Use the competitor filter to change the pricing benchmark.
- This will change the benchmark of the market average to benchmarking against another brand. This means that an index of 105 for mid-tiers means the selected brand's mid-tier products are 5% higher than the mid-tier products of the selected competitor brand.
- Use this to get a better understanding of your pricing vs key competitors in the market selling similar products.
- This will change the benchmark of the market average to benchmarking against another brand. This means that an index of 105 for mid-tiers means the selected brand's mid-tier products are 5% higher than the mid-tier products of the selected competitor brand.
Note: because price tiers are defined at such a specific level, to get the most accurate price comparison we recommend being specific with time periods, states, channels, categories, and pack sizes while using the dashboard.
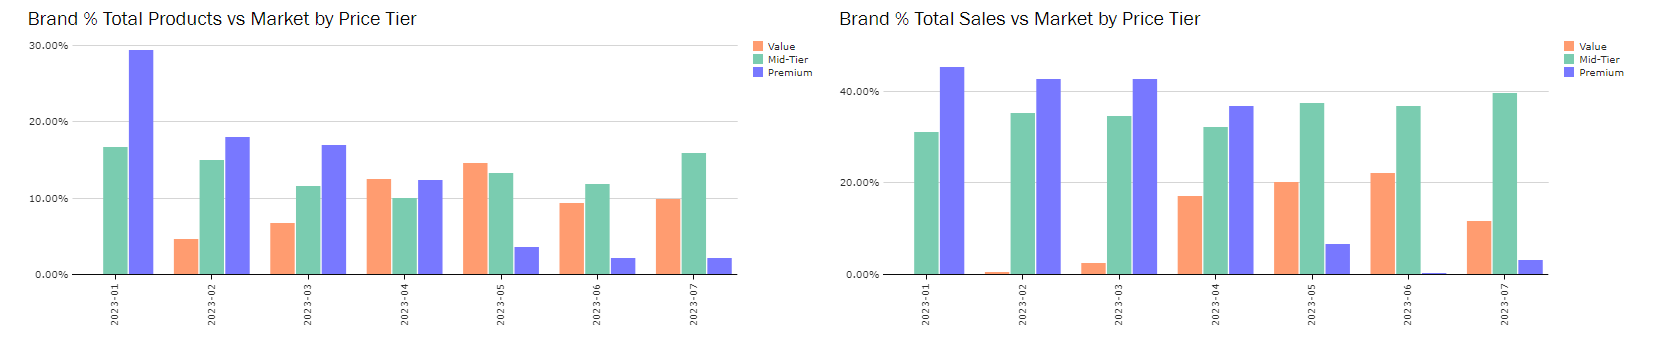
In the brand overview section, use the trending visuals to compare actual product counts and sales, the above benchmarking visuals add context of what the product counts and sales are per tier vs the market.
-
Brand's % of Total Products vs Market measures the percentage points higher or lower that the market's average % distribution of products by tier.
- For example, if the selected brand has 55% of their products classified as Mid-Tier and the market average % of products in 50%, Mid-Tier will be displayed at 5% because there are 5 percentage points more products for that brand that are Mid-Tiers. the market.
- Brand's % of Total Sales vs Market measures the percentage points higher or lower that the market's average % distribution of sales by tier.
- For example, if the selected brand has 55% of their sales coming from Mid-Tier products and the market average % of sales coming from Mid-Tier products is 50%, Mid-Tier will be displayed at 5% because there are 5 percentage points more sales for that brand that are Mid-Tier vs. the market.
- In the above example, as time has gone on the brand has had more and more of their products leave premium and move to mid-tier & value. When looking at the sales for each tier, they are actually gaining more sales from their mid-tier & value products in most recent months compared to the market. This could indicate that the slight increase in value products in the last few months are contributing heavily to their total sales compared to other value products in the same category and pack size.
- Use the competitor filter to change the pricing benchmark.
- This will change the benchmark of the market average to benchmarking against another brand. This means that if the selected brand has 55% of their sales coming from Mid-Tier products and the competitor brand % of sales coming from Mid-Tier products is 50%, Mid-Tier will be displayed at 5% because there are 5 percentage points more sales for that brand that are Mid-Tier vs. the competitor brand.
- Use this to get a better understanding of where the majority of a brand's sales are vs a competitor.
- This helps identify what competitors in a market are selling with a similar price strategy, as well as being able to compare assortment and sales at each tier vs a competitor.
- For example, a brand may know that their product assortment is similar to a competitor as far as price, but this added context can visualize if even though they are priced similarly, if the brand is far outselling in a certain tier and should consider being more competitive at that price point.
- This will change the benchmark of the market average to benchmarking against another brand. This means that if the selected brand has 55% of their sales coming from Mid-Tier products and the competitor brand % of sales coming from Mid-Tier products is 50%, Mid-Tier will be displayed at 5% because there are 5 percentage points more sales for that brand that are Mid-Tier vs. the competitor brand.