Table of Contents
Key Questions Answered
- Are the majority of a brand's products premium, value, or mid-tier?
- What value tier do the majority of sales fall into in a market or category?
- What are the top brands in each value tier?
- Is the pricing of a brand's product assortment in line with the price tier that sells the most volume?
- As pricing dynamics have changed in a market, has a product's price tier changed?
Note: all prices are pack ARP, so the dashboards are available from January 2022 onward
Methodology
The assignment of price tiers is determined by comparing the product's pricing with that of other like products, considering factors such as time period, state, channel, lowest category level, and pack size.
Ex: the price distribution of all 1g live resin dabbable concentrates in the Michigan adult use channel during the month of March.
These price tiers are classified based on percentiles.- "Value" refers to products priced at or below the 25th percentile
- "Mid-tier" includes products priced between the 25th and 75th percentiles, and
- "Premium" encompasses products priced at or above the 75th percentile.
- Low Sample: If there are fewer than 20 SKUs falling into a specific product type, or if the average retail price for a product is less than $1
- Single Price: If there is on only one price across all SKUs within a product classification
Note: because price tiers are defined at such a specific level, to get the most accurate price comparison we recommend being specific with time periods, states, categories, and pack sizes while using the dashboard.
Market Overview and Price Tier Breakouts
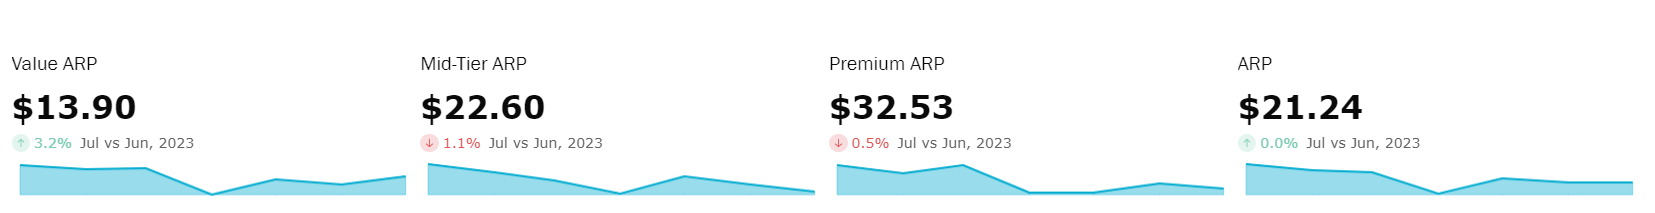
Use the snapshots across to the top to see the ARP by tier for the most recent month selected in the date filter and how it has changes from the previous month.
- Pricing across tiers follows the same pricing methodology as other Retailer Sales Tracking dashboards - post discount, pre-tax.

The sliding bars across the bottom of the visual are price trends, so hovering the mouse over a spot will change the displayed ARP value and it's % change from the previous month.
- Pricing across tiers follows the same pricing methodology as other Retailer Sales Tracking dashboards - post discount, pre-tax.
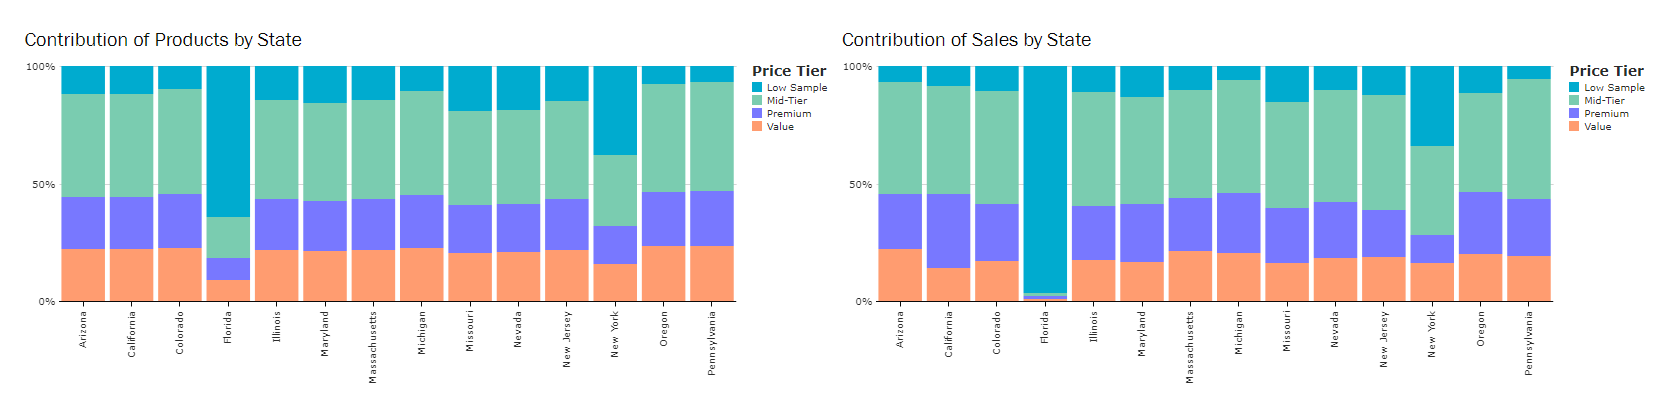
- Price Tier Breakouts displays contribution of SKUs and contribution of dollar sales by state. Contribution of Products looks at the total number of products per state and breaks out the percent of products that fall into each price tier.
- Contribution of Sales looks at the total dollar sales in each state and breaks out the percent of dollar sales that fall into each price tier.
- Using these two views together allows the user to determine whether the assortment of products is aligned to where the majority of dollar sales occur.
- For example, if there is a higher percent of sales in a tier than there are products in the market, it could be an indicator that prices should move closer to that tier for the defined category or brand because there's more demand at that price.

Use the Top 10 Brands to view the top 10 brands* in each price tier and compare the distribution of products and sales.
- A brand's price tier is assigned based on which tier the majority of its products are classified.
-
- A brand's tier assignment can change based on selected filters. For example, a brand's entire portfolio may be majority mid-tier, but in a specific category, or pack size they may be more premium.
- The *top 10 brands are determined by the brand's total sales across all tiers.
Category and Pack Size
Start comparing sales and pricing at the category and pack size level.
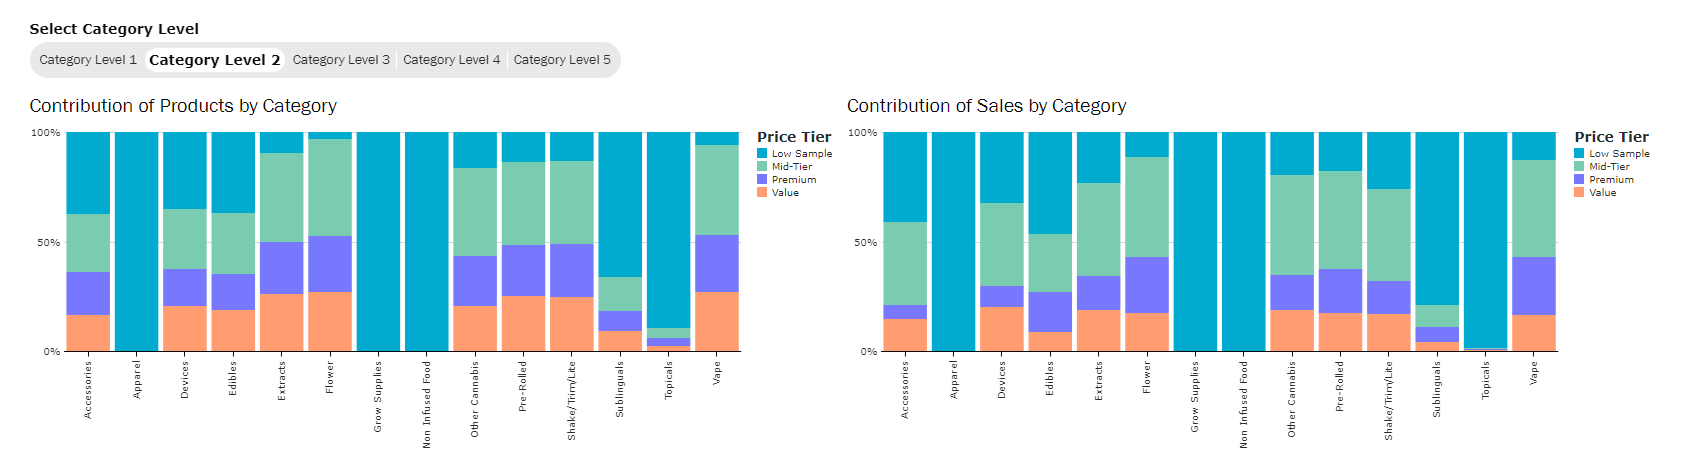
- Contribution of Products visual looks at the total number of products per category and breaks out the percent of products that fall into each price tier.
- Contribution of Sales visual looks at the total sales in each category and breaks out the percent of sales that fall into each price tier.
- Using these two views together can identify if the assortment of products is aligned to where the majority of sales are concentrated.
- For example, if there is a higher percent of sales in a tier than there are products in the market, it could be an indicator that prices should move closer to that tier for the defined category or brand because there's more demand at that price.
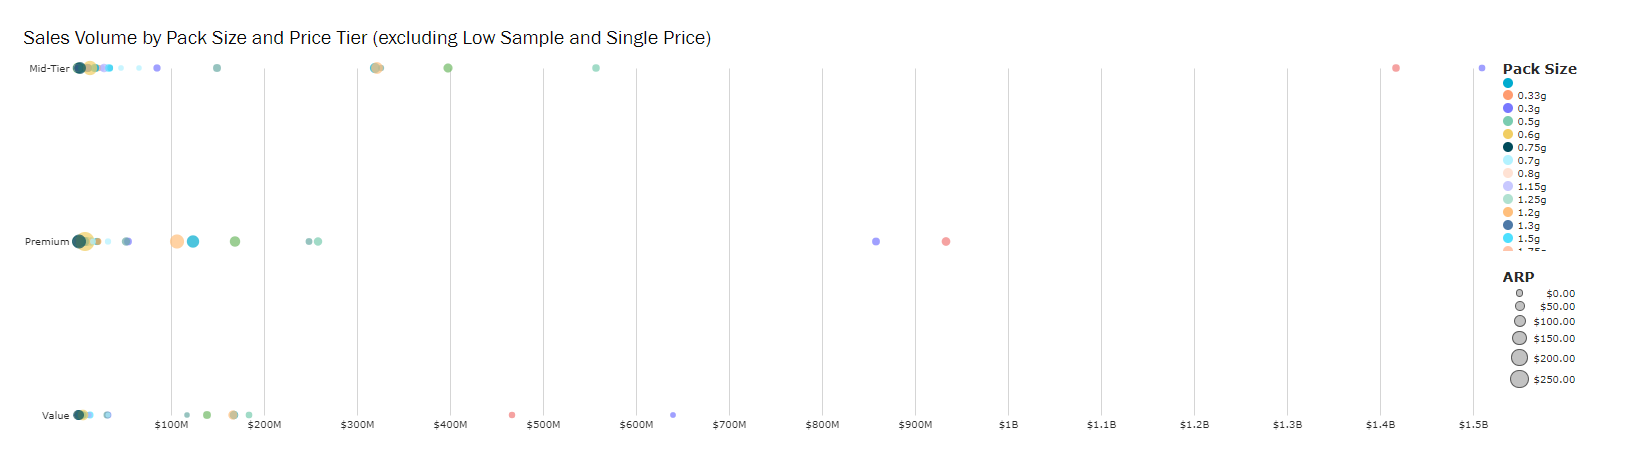
Because price tiers are defined at such a granular level, it's important to compare prices down to the pack size.
- Use filters to select a category and populate the price distribution of pack sizes by price tiers.
- Dot placement is based on total sales of the pack size by tier, sized by ARP.
- Leverage this visual to drill into insights from previous views. By category, find the highest selling pack size and what price strategy is producing the highest sales.
Price Tier ARP - Trending
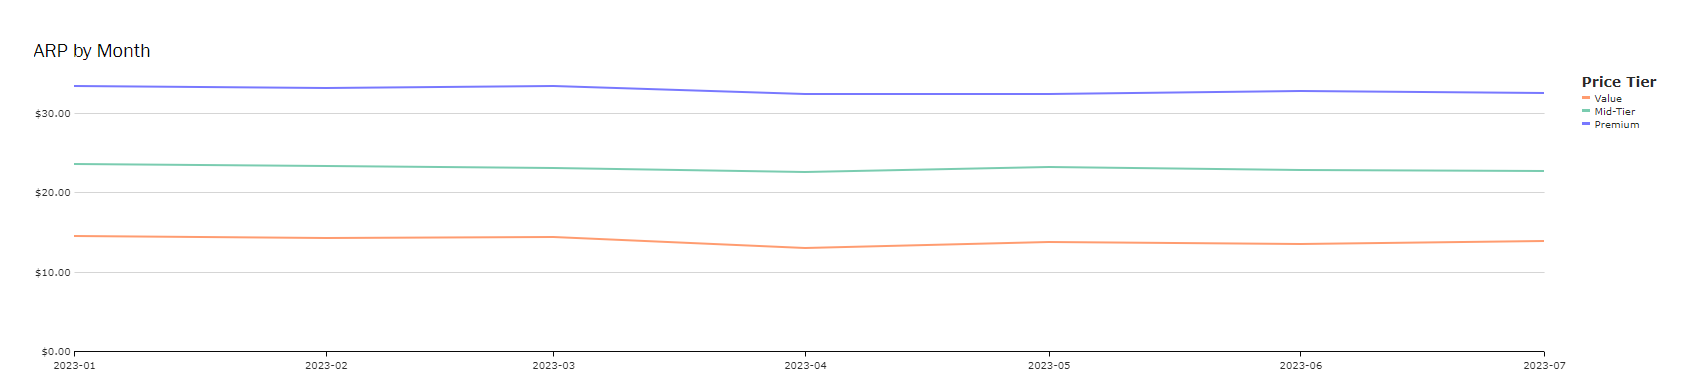
Follow how the price of each tier has changed overtime.
- Use state and category filters to gain context of overall pricing trends in the market.
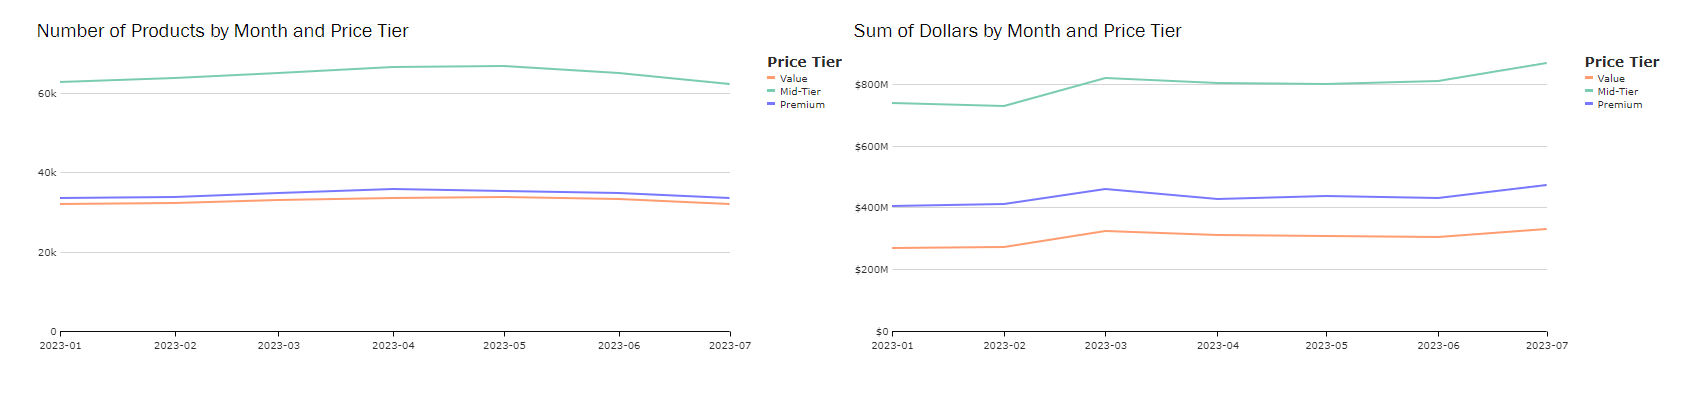
Compare how trending pricing changes have impacted total sales and product counts.
- Use filters to understand how sales have changes by price tier overtime by category, brand, or state.
- Leverage this information to evaluate a brand or product's price strategy based on where the sales are trending.
Appendix
Below is an example of how tiering is determined. Each price represents a different SKU within a product grouping (100mg THC Gummie Candy) in the same market and month. These prices are them broken out into percentiles.
Percentiles break up the data to represent the percent of observations priced at or below that value. The 25th percentile means that 25% of SKUs are priced at or below that price ($19.13). The 75th percentile means that 75% of SKUs are priced at or below that price ($32.00). This is why it is important to look at the same type of product when tiering out products – it avoids any possible skewing of the data based on different sizing or product types (like Gummie Candy that has any type of added cannabinoid vs just containing THC).

