Table of Contents
Pricing by Attributes & Increments
Key Questions Answered
- What is the relationship between changes in ARP and units sold?
- I want to position my brand as a value-tier product. What is the minimum average price being sold in the market?
- I want to expand my product line to new attributes and pack sizes. What are the average prices by attribute I can use to guide my pricing decisions?
- What is the distribution of units selling at each price point?
- I ran a promotion on a brand during a specific week of the month. Was there an increase in sales that week for the brand?
Snapshot
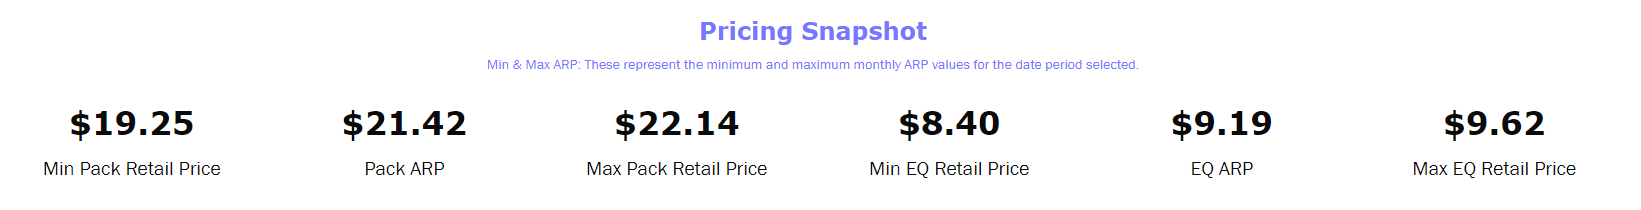
Provides quick insight into average Pack and EQ price, as well as the minimum and maximum prices sold at, aggregated to the week.
- Ex: if the date filter is set to 2022, the min ARP is the lowest weekly ARP in 2022, and the max is the max weekly ARP in 2022. (See this article for more information)
Pricing Trending
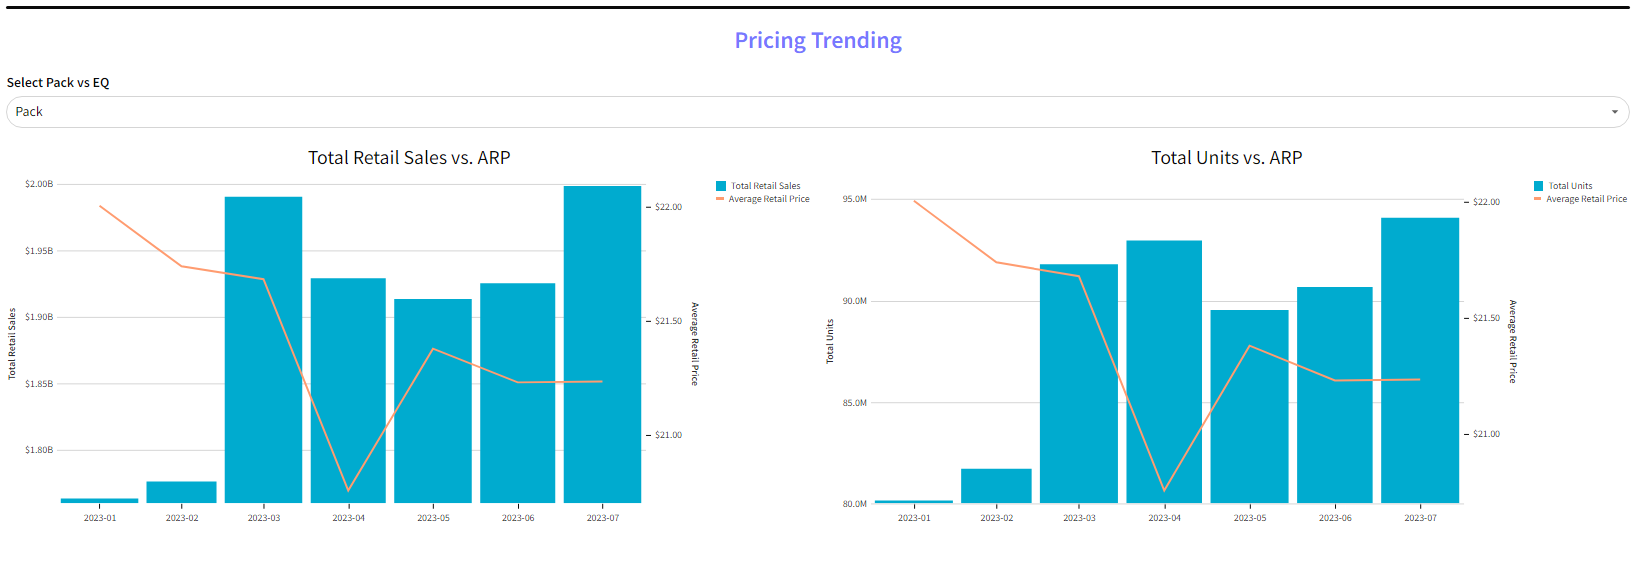
Trending retail sales or units vs. ARP. Use the selector to view Pack or EQ ARP.
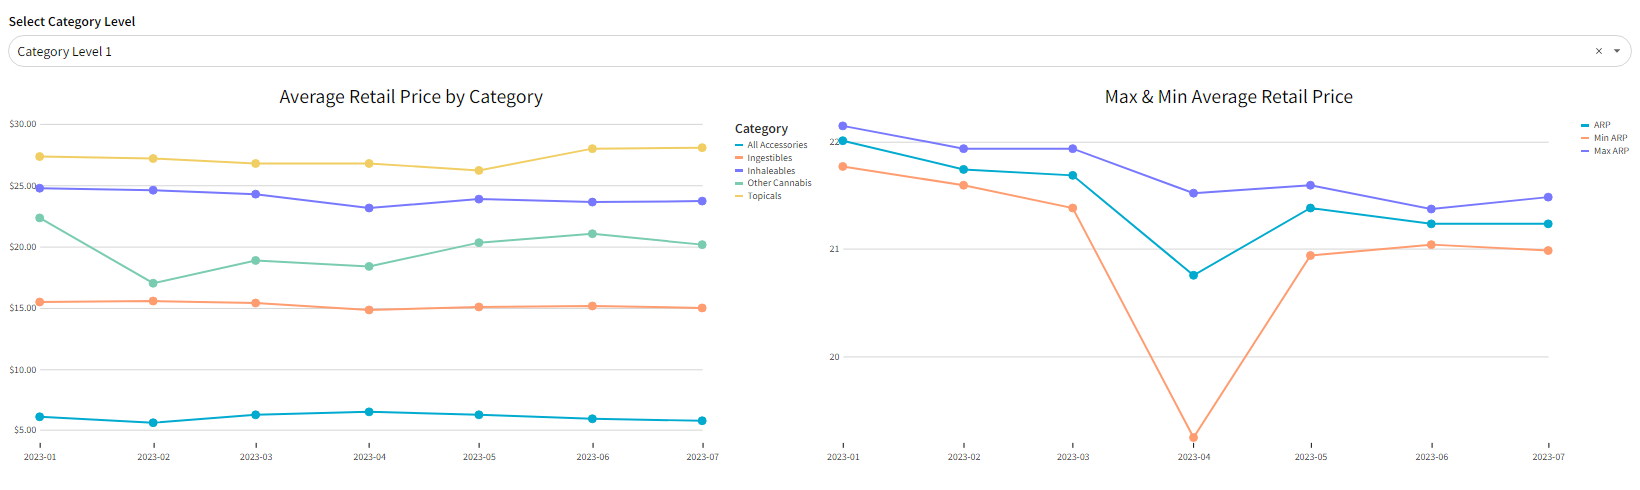
Trending price by category and an overall market view of minimum, maximum, and average retail prices.
- Use the category selector and filters to drill into more specific category trends.
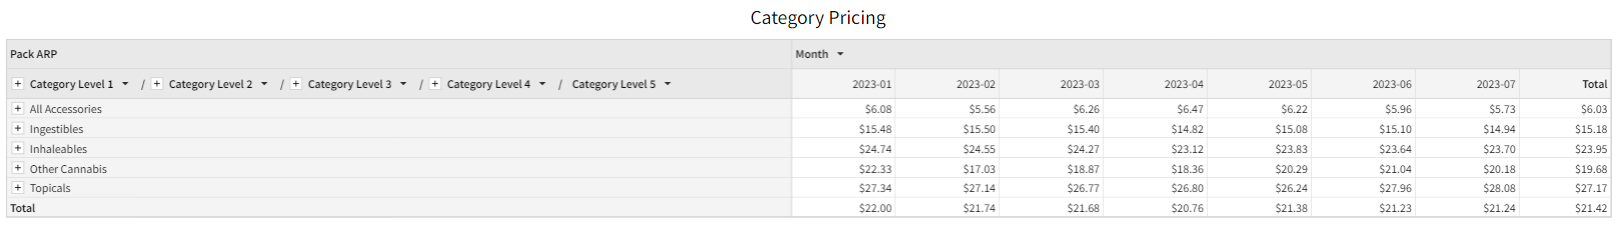
Get total trending granularity into the average retail price. Click the plus icon to expand into more granular subcategories.
Pricing by Attributes & Increments
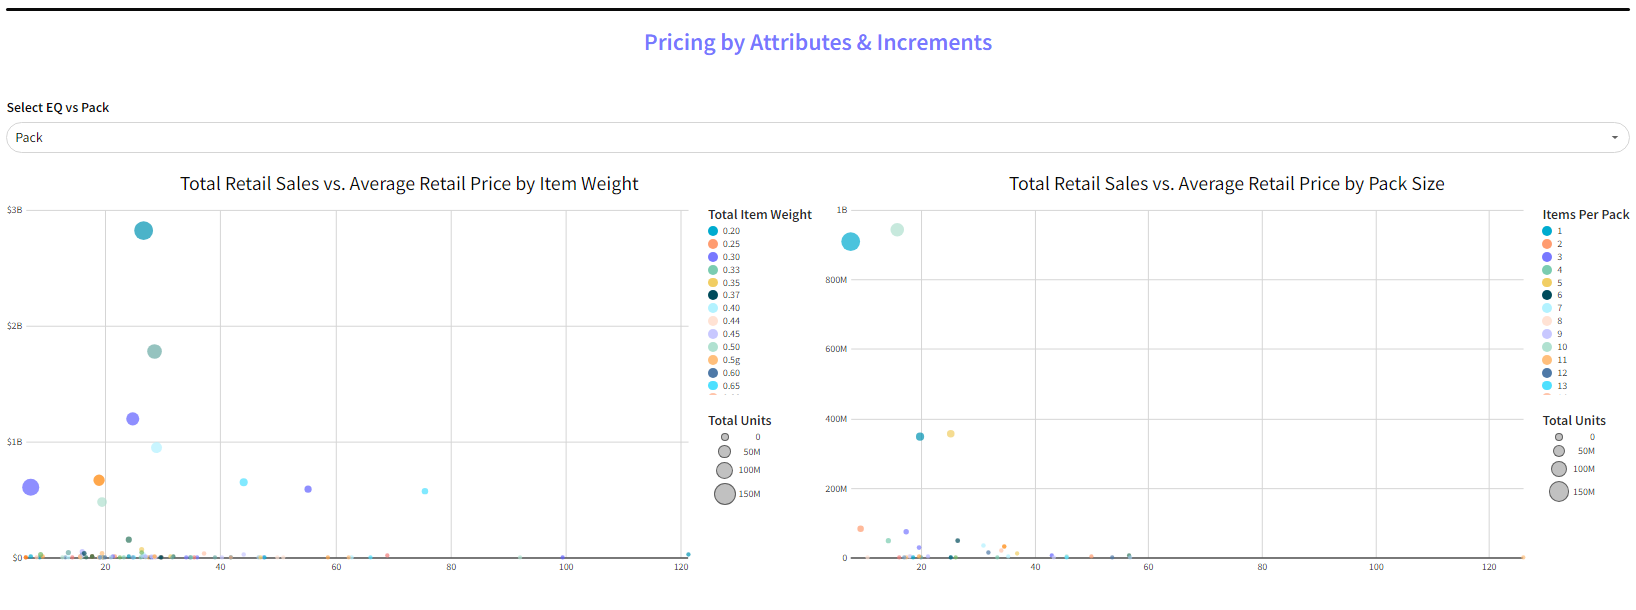
View pricing distribution by weight and pack size.
- The X-axis is ARP.
- The Y-axis is the total retail sales.
- The dots are sized according to EQ units sold in the selected period.
Tip: Best used when filtering to a specific category with a consistent array of weights and pack sizes.
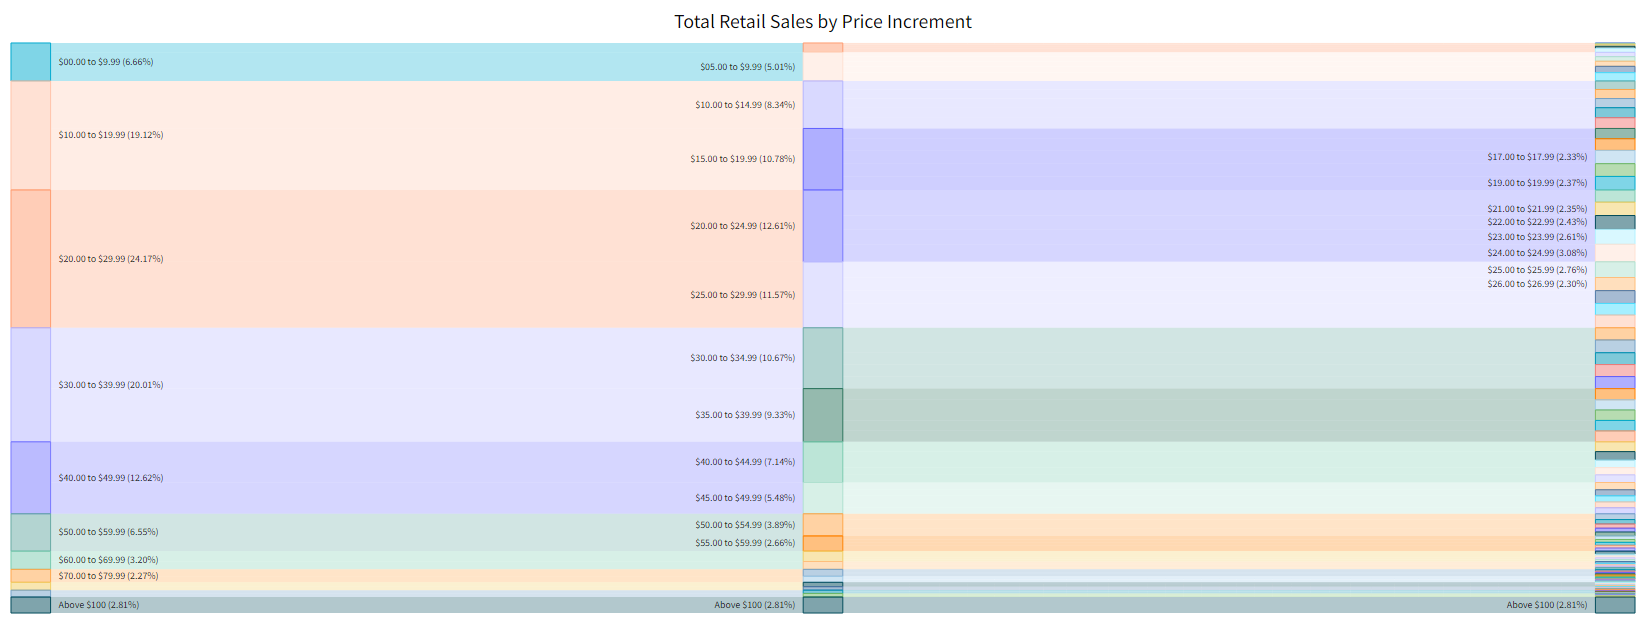
View total retail sales and share by various price increment levels ($10, $5, and $1 increments). The sizes of each section relate to total retail sales within that price increment.
Tip: Best used when filtered to a specific category to understand the concentration of prices and where your brand falls in that array.
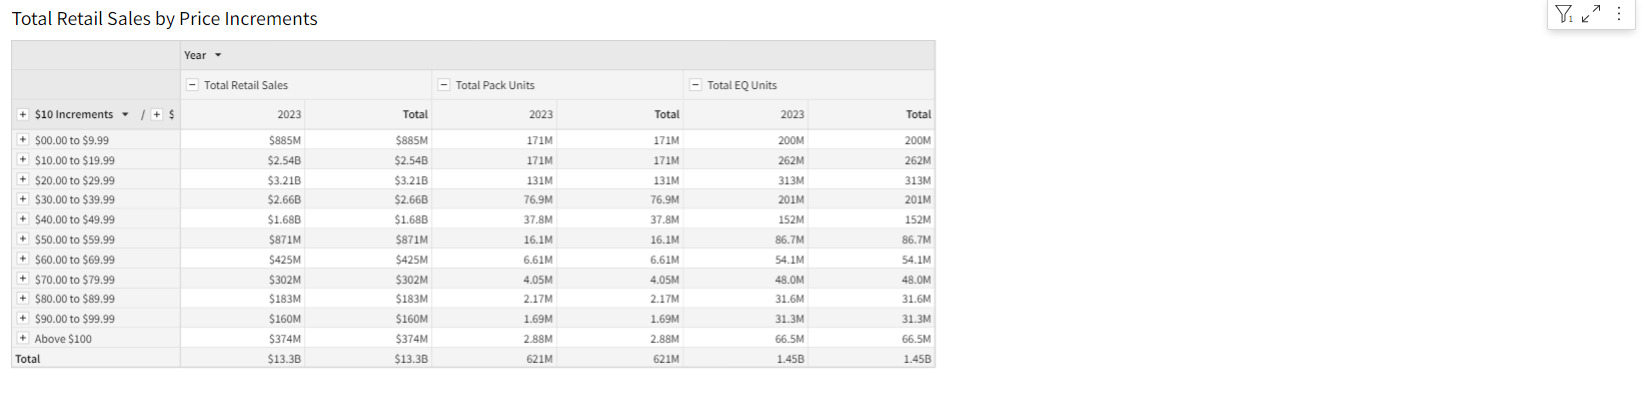
Get trending granularity into total retail sales by price increment. Click the plus icon to expand into more granular price increments.