
Evaluate a brand or product's sales effectiveness from shelf to basket
Table of Contents
Key Questions Answered
- What percent of total retailers in a region is my product selling in?
- Are there any regions my competitors have low distribution in that can help guide my wholesale strategy?
- What brands and products are expanding the fastest in a market? Are there commonalities about the types of products that are increasing distribution?
- Is my competitors performance more influenced by distribution or velocity?
- Now that I have sold in product to several dispensaries via wholesale, how are they selling through?
Overview
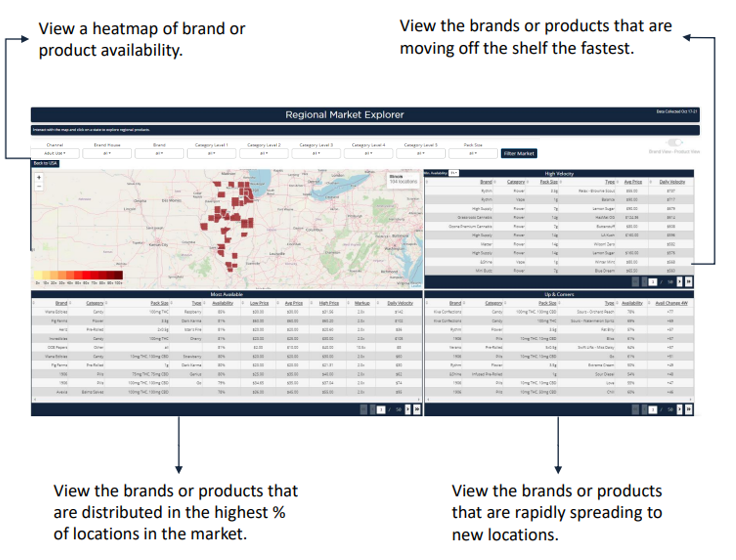
Heat Map
Use the heat map to drill in from country all the way down to city. Other charts will populate once a state is chosen.
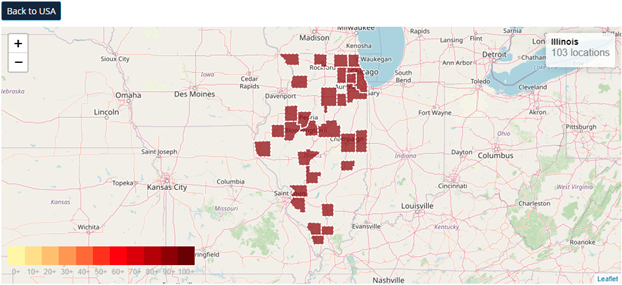
Keep track of what regional you're looking at and the number if dispensaries in that location using the label in the top right corner.
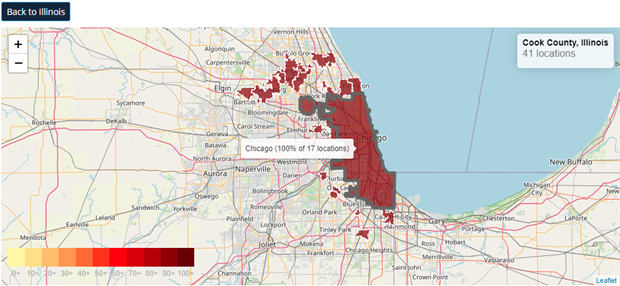
Hover over a region to see the number of dispensaries in that area.
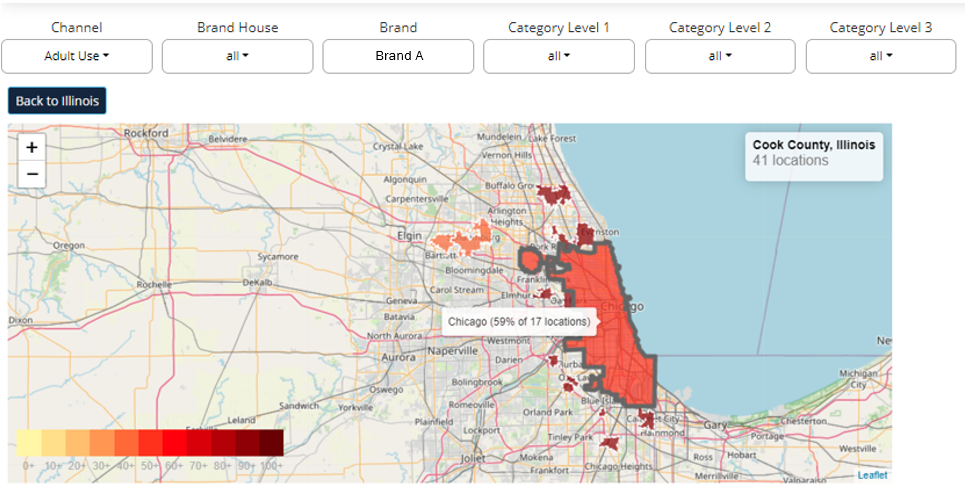
The heat map scale measures the percentage of locations that fit the parameters set in the filters.
-
For example, setting the Brand filter to Brand A and hovering over Chicago tells us that 59% of the 17 Adult Use locations in Chicago sell Brand A products.
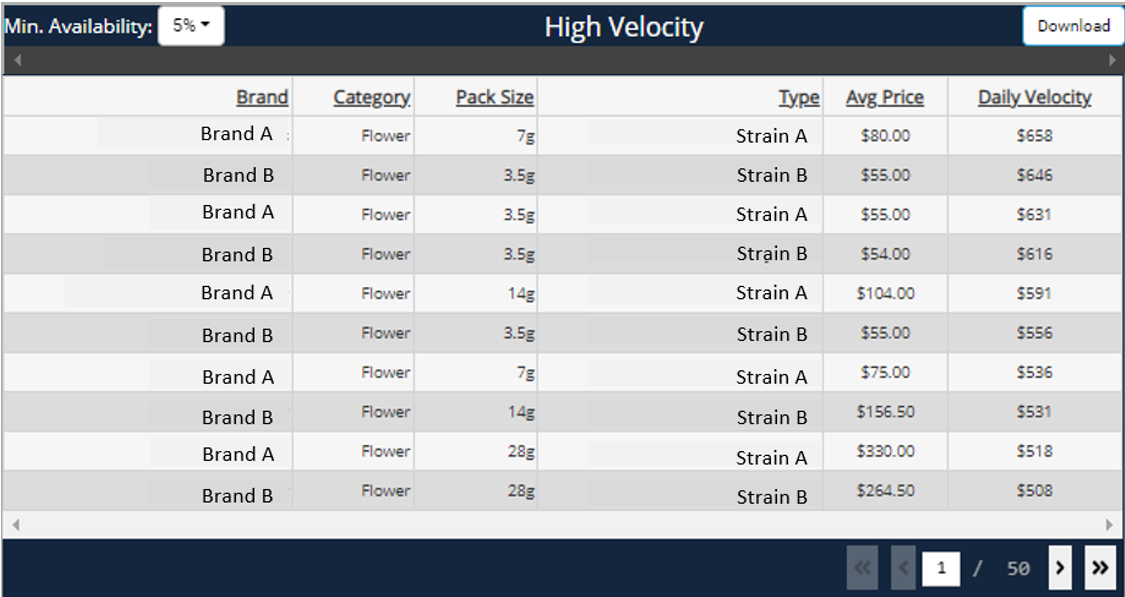
High Velocity
The High Velocity table orders brands or products by how well they perform on store shelves.

What is Daily Velocity?
- Daily velocity measures the average sales per retail location it is selling in per day at the state level.
- Velocity provides more context to a brand's total sales in the state. While sales can give you an idea of a brand or product's total performance, velocity accounts for how many stores the brand or product sells in.
- Because velocity is calculated at the state level, it will not change when filtering more granularly into a market.
- Ex: a brand might be #1 in a market when looking at total sales, but if they are distributed in every location, that total sales number could be driven by availability rather than actual product demand or brand loyalty.
Why would I want to change the Minimum Availability?
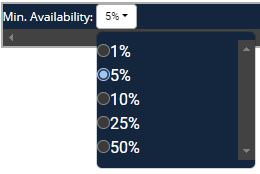
- The minimum availability filter allows users to toggle to only see the velocity for brands and products that are greater than or equal to a certain percentage of distribution.
- This is helpful for filtering out brands that may have exclusive partnerships or are owned brands of a dispensary that sell very well, but are only in a few locations. This can result in a very high velocity, but a brand that is more focused on wholesaling may want to filter these brands out and focus more on brands that are wholesaling widely as well.
Is Average Price different than ARP in the Retail Sales Tracking dashboards?
- Yes, Average Price within Menu Analytics is the average listed price, and ARP within Retail Sales Tracking is the average price paid. The Average Price does not include any at-checkout discounts such as loyalty points, promotions, etc., which the Retail Sales Tracking ARP does.
Most Available
The Most Available table provides a brand's distribution in a market to create a total picture of which brands and products are the easiest to find.
- Product Level view includes details on the high and low prices the product sells at, along with product descriptions like pack size and type.
What is Availability?
- Availability measures the percent of all locations in the defined region that sells the brand or product.
- Check the label in the top right corner of the map to reference the base number of doors for availability.
- Ex: if out of 100 total locations, 50 of them sell the specified product, the Availability will be 50%.
What is Markup?
- Markup measures the multiplier increase from the statewide average wholesale cost to the average listed retail price in the selected region.
- Ex: if the statewide average wholesale cost for a product is $10 and a dispensary prices it on their menu at $20, the Markup will be 2x.
What are High and Low Price?
- High Price
- The 95th percentile price that item is selling at.
- I.e. this price is higher than 95% of the other prices that item is selling at.
- Low price
- The 5th percentile price that item is selling at.
- I.e. this price is higher than only 5% of the other prices an item is selling at.
- Use High and Low Price in conjunction with Average Price to get an idea of price distribution of an item.
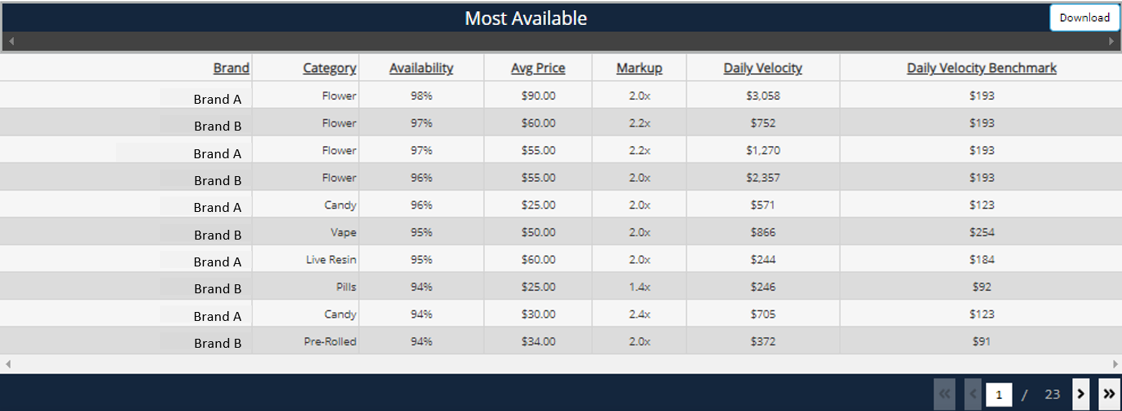
Toggle to Brand view to include the Daily Velocity Benchmark within the Most Available table.
What is Daily Velocity Benchmark?
- The average daily velocity of all brands in the same state, channel, and category grouping.
- Use this as a benchmark to index a brand's velocity against similar brands.
- Ex: If a brand’s Velocity is $500 and the Daily Velocity Benchmark is $400, that brand sells 25% more per store per day than similar brands in that state.
Up & Comers
The Up & Comers table tracks changes in a product or brand's availability over the last four weeks.
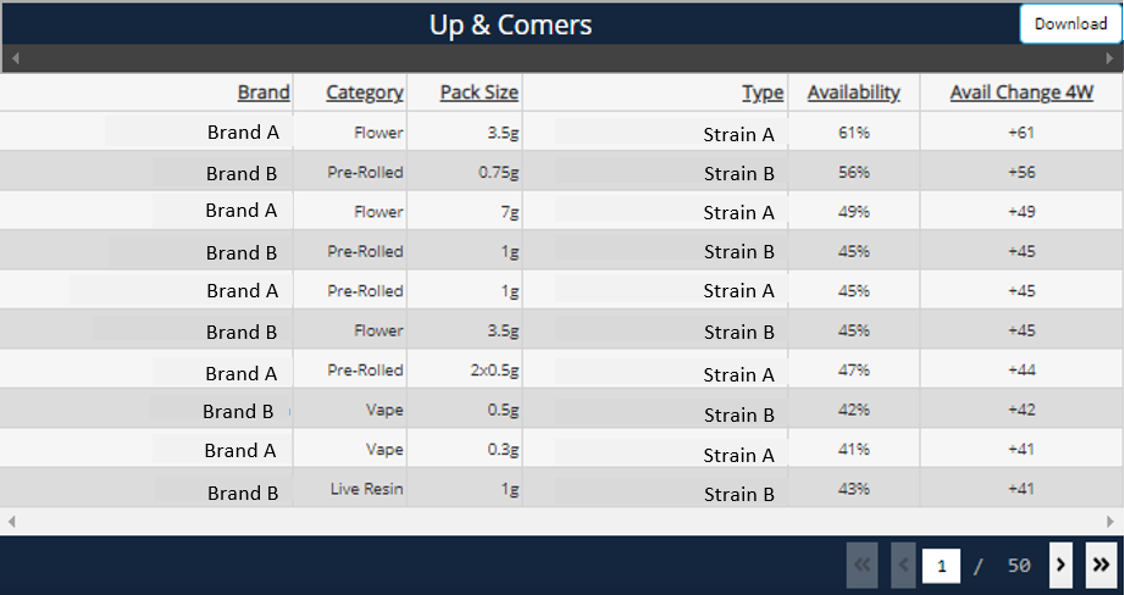
What is Availability Change 4W?
- The percentage point change in brand or product availability in the last four weeks.
- Note that this is not the direct percent change in Availability.
- Ex: if a product’s Availability is 50% and four weeks later the product’s Availability is 60%, then the Availability Change 4W will be +10.