Table Of Contents
Please note these dashboards are only available for Retail Data Sharing Partners who subscribe to Basket Analytics.
Key Questions Answered
- Which categories are purchase drivers (i.e. single category purchases)?
- Are single category or multi-category purchases driving the largest basket size?
- Should I be pairing promotional efforts with items in the same category, or items in a different category?
- Will my budtender recommending multiple flower products or a flower and a pre-roll product produce the largest basket size?
Trending & Location Basket
-
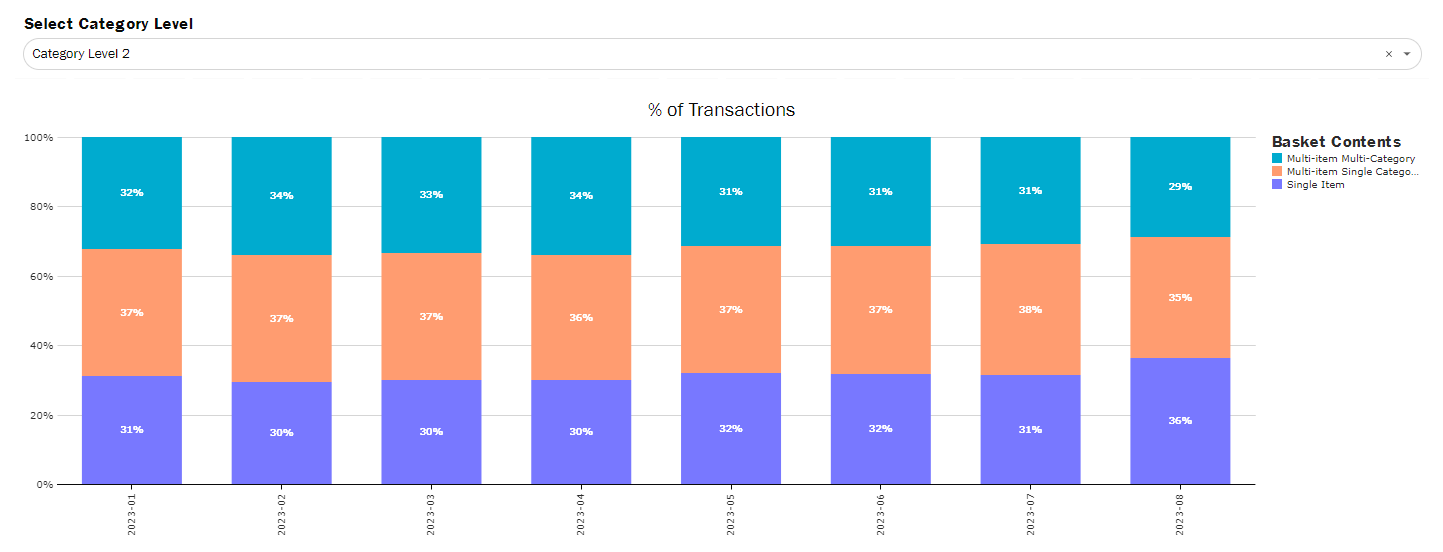
Track over time what categories are most likely to be bought alone, with multiple items in a single category, or to be paired with items in other categories.
Each column represents 100% of transactions in that period and is made up of the % of transactions that fall into each of the categories.
- Single Item means that a single item was purchased.
- Multi-Item Single Category means that multiple items were bought in a single category.
- Multi-Item Multi-Category means that multiple items were bought across more than 1 category.
- Use category level selector to ensure categories are being compared to other categories in the same level of the hierarchy.
- Ex: When set to "Level 2", Flower and Extracts purchased together show as multi-item multi-category, but when set to "Level 1", they are multi-item single category because they both fall under Inhaleables.
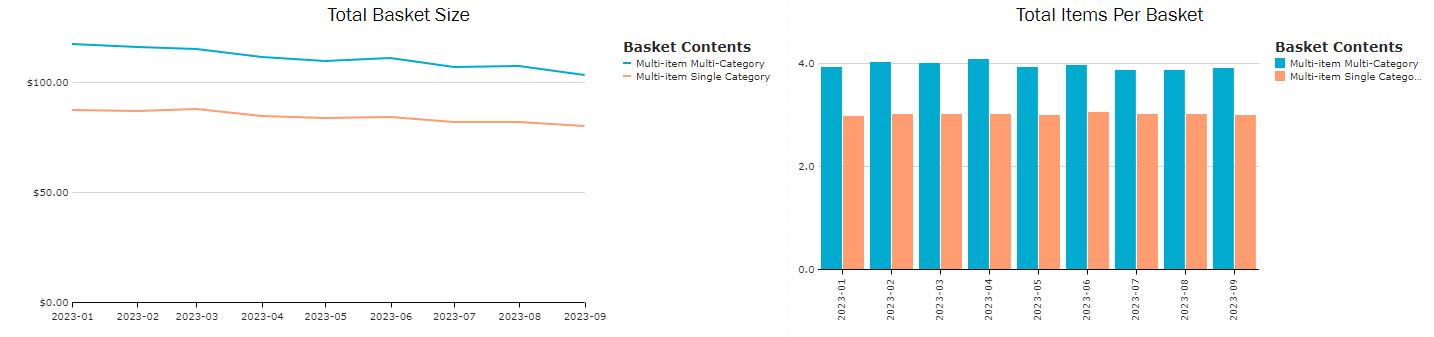
Using the same 3 classifications of transactions, you can track how large a basket is and the number of items purchased in a transaction (filtered to remove Single Item as there is always going to be the same number of items per basket). This view can be helpful to track over time what categories perform best on their own vs paired with other categories.
- Please note that number of items is an average number, so it will not always be a perfectly rounded number (ex: 2.9 items per basket).
Basket Category Contents
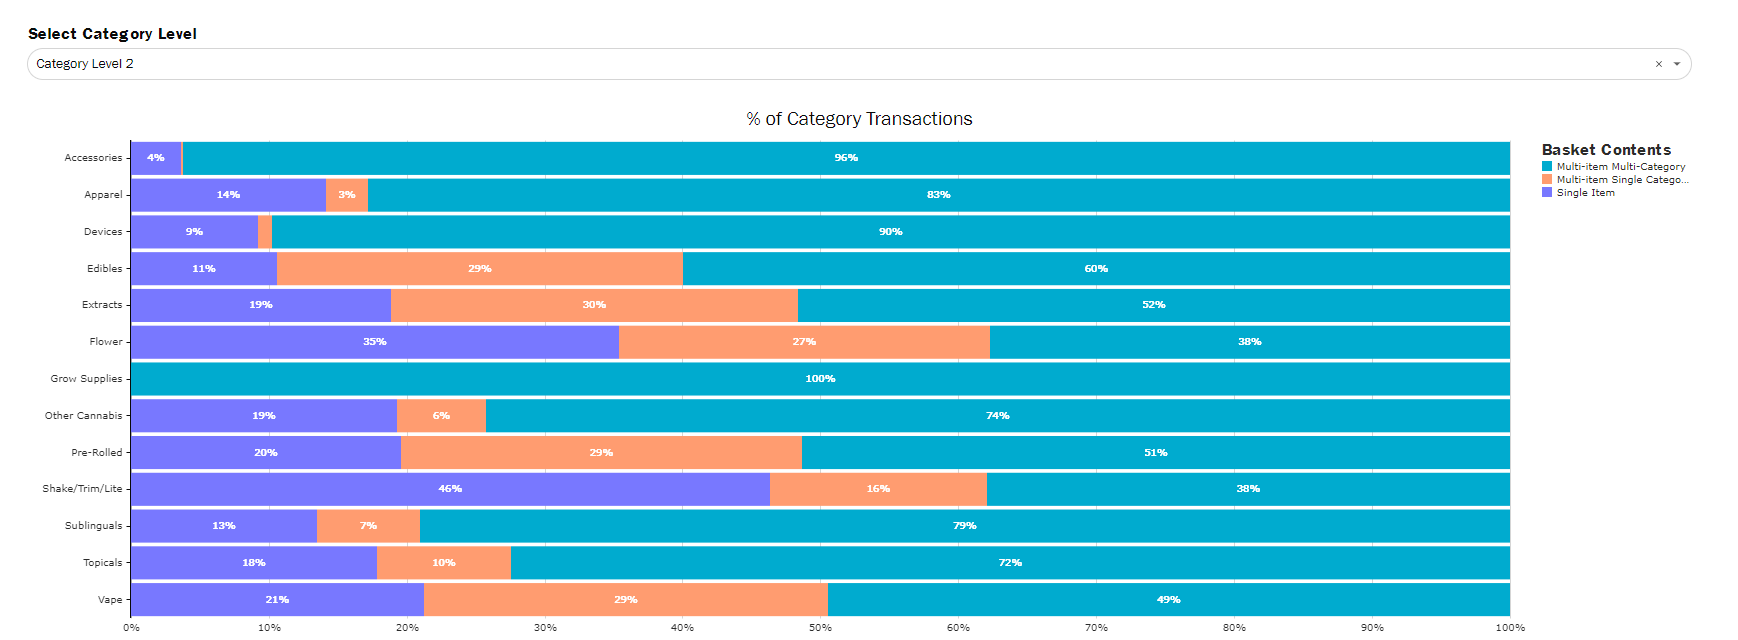
Each column represents 100% of transactions that contain an item in each of these categories. Then it is broken down by the 3 classifications.
- Use this to see which categories at each hierarchy level are most likely to be bought with items in that category, or with items in another category.
- Use the drop down across the top to control which category level you want to see.
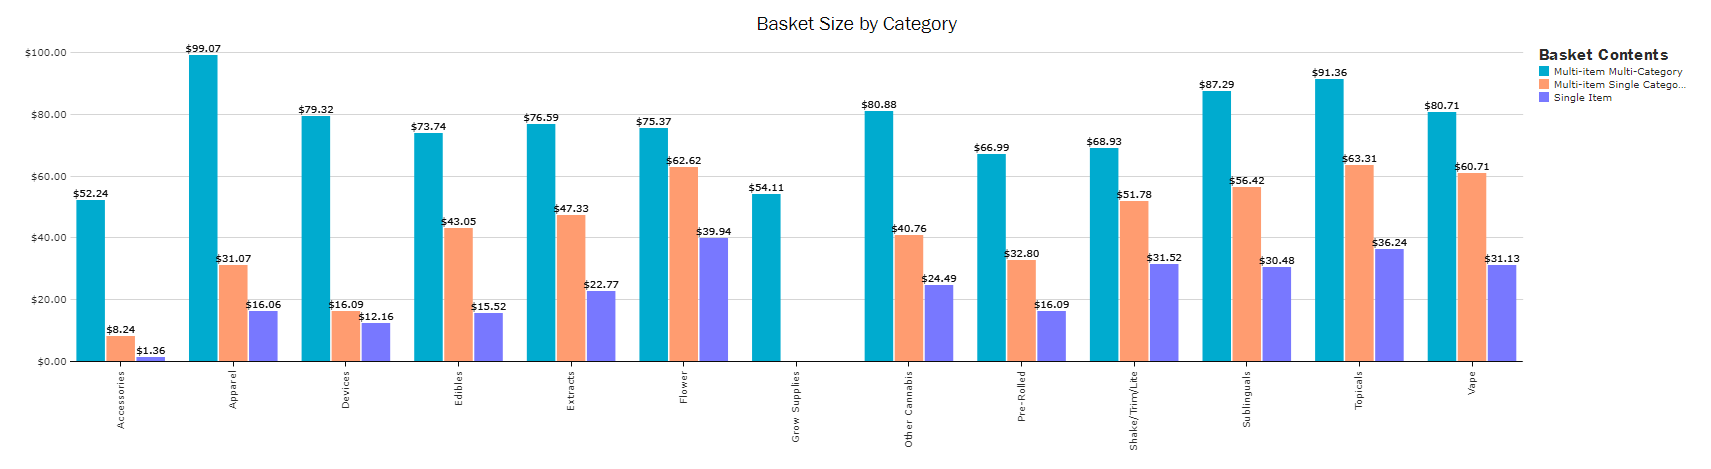
You can also track which assortment is going to provide the largest basket size using the Basket Size Widget.
- Ex: Flower items bought with other categories are going to yield a larger total sale amount than trying to selling two Flower products
Basket Brand Contents
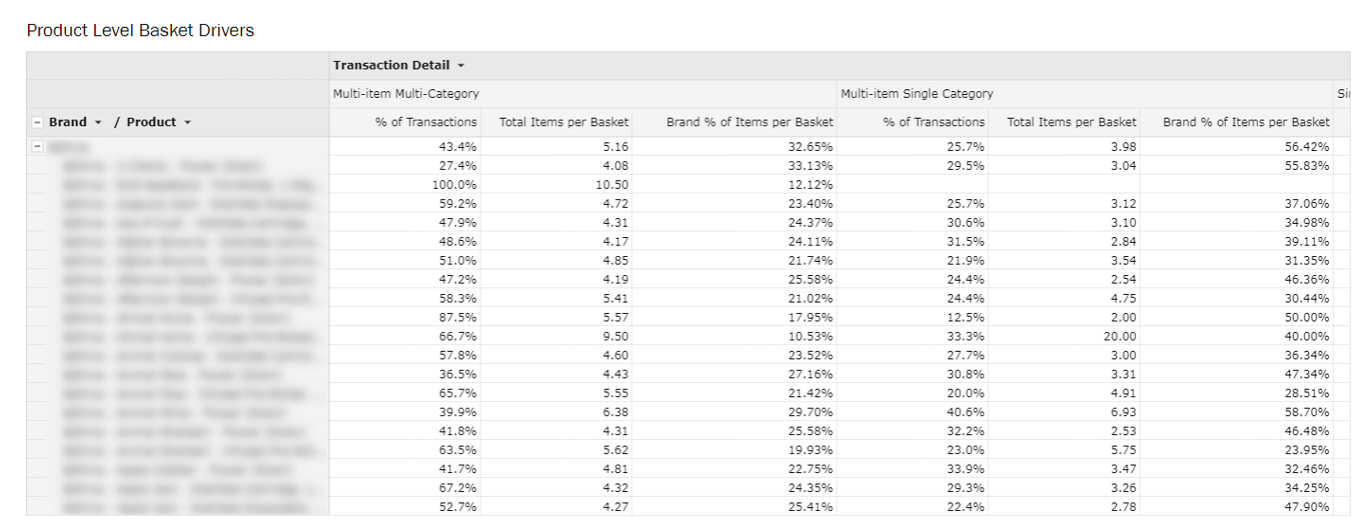
- Use the product level export to see at a brand or product level the % of transactions for each product that are sold alone or with another item
- Total Items per Basket is the average number of items in a basket that contains that brand or product and falls into one of the content classifications.
- Brand % of Items per Basket measures for that brand or product, what % of those total items belong to that brand or product
- Ex: for multi-item multi-category purchases that contain Brand A, there are an average of 5.16 items in each basket. Of those 5.16 items, 33% of them belong to that brand or are that product (depending on the level being evaluated).
- Can be used to better understand what products are main drivers for purchasing vs regularly bought with other products
- Dig in deeper to what products are being purchased together using the Basket Cross Analysis Dashboard.