Table of Contents
Day of Week
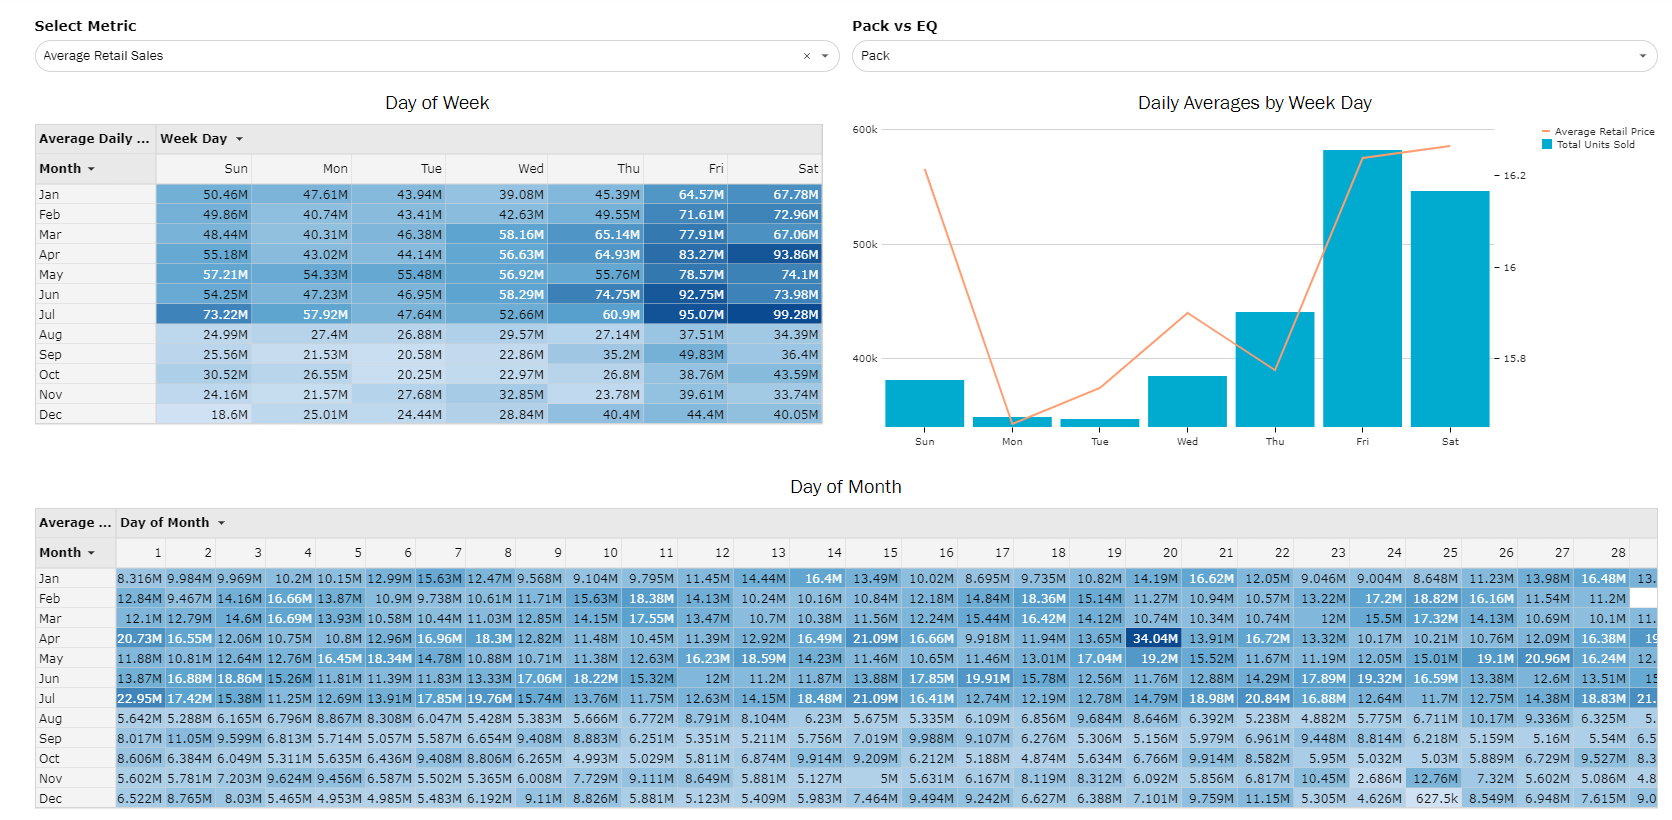
- Use the calendar heat map to track dollars, units, and ARP by day of week and month.
- Dark blue = more sales, light blue = less sales.
- Follow the relationship between dollars and ARP based on the average sales and ARP for each day of the week.
Seasons
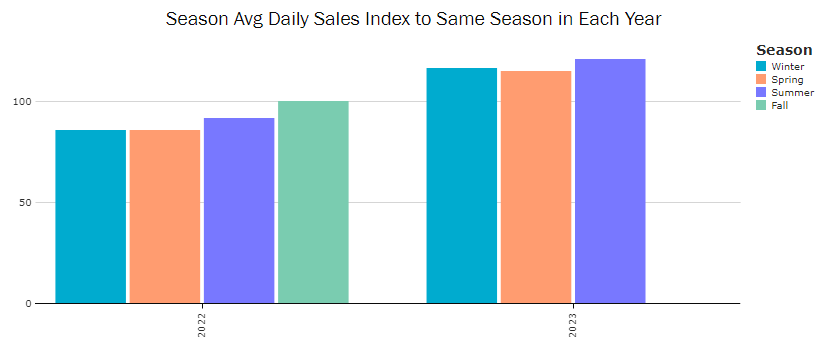
- View the daily sales index relative to the average daily sales for a season across all years.
- Index is always relative to 100 and represents the % above or below that baseline.
- Ex: the avg daily sales index for Spring across all visible years is 100, so the Spring 2022 Index of 116 means that the average daily sales in Spring 2022 are 16% more than the average daily sales for Spring across all years.
- Same logic follows for ARP but an index of 116 would mean the average price is 16% higher.
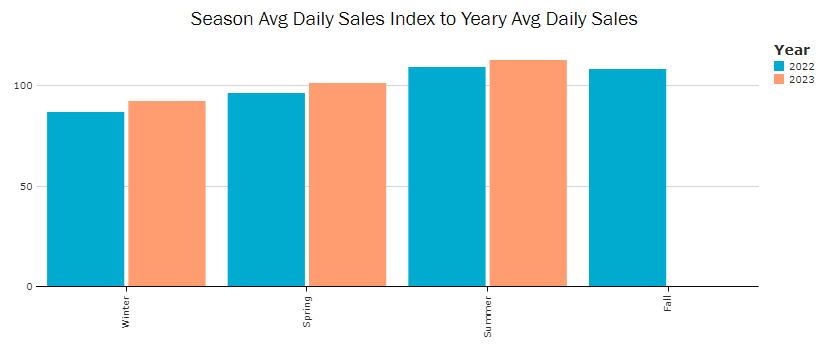
- View the daily sales index relative to the average daily sales for all seasons in a single year
- Index is always relative to 100 and represents the % above or below that baseline.
- Ex: the avg daily sales index for 2022 is 100, so the Spring 2022 Index of 101 means that the average daily sales in Spring 2022 are 1% more than the average daily sales for all seasons in 2022.
- Same logic follows for ARP but an index of 101 would mean the average price is 1% higher.
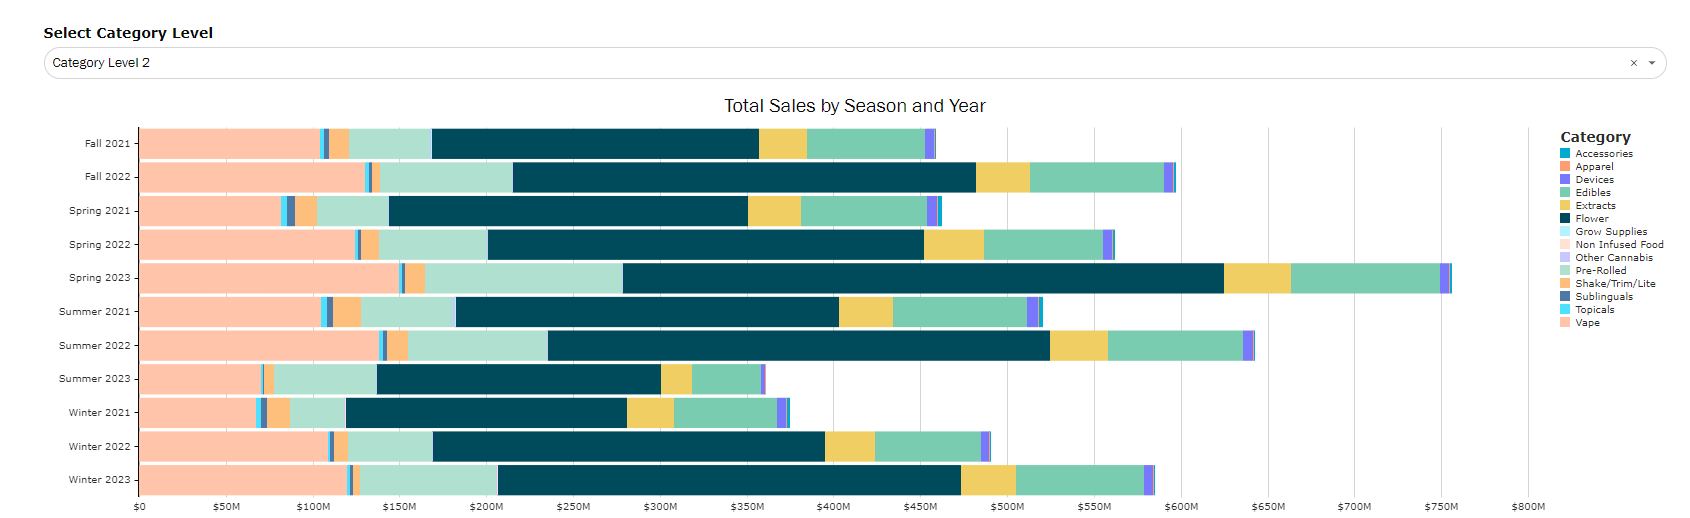
- Follow total volume and category trends.
- The total length of the bar represents the total volume of sales across all categories for that season & year.
- Within each bar, hover over the different color bars too see the % makeup of the total volume attributed to each category.
- Use the drop down above the chart to break each bar down to different category levels and see category trends across the different seasons and years.
Holidays
Holidays included:
- New Years Eve
- New Years Day
- Martin Luther King Jr Day
- Valentines Day
- "4/20"
- Mothers Day
- Memorial Day
- Fathers Day
- Independence Day
- Dab Day (7/10)
- Labor Day
- Halloween
- Veterans Day
- Green Wednesday
- Thanksgiving Day
- Black Friday
- Christmas Eve
- Christmas Day
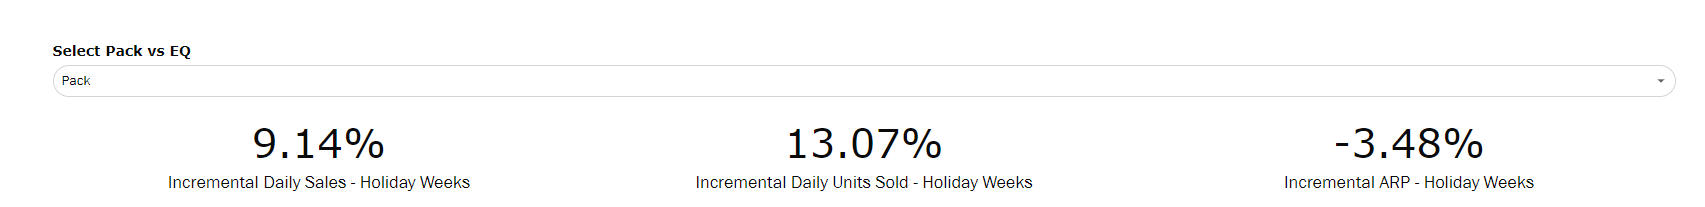
- Track overall incremental dollar and unit sales.
- Incremental sales are the % difference in sales compared to non-holiday weeks on average.
- Ex: looking at the first metric, on an average day during a holiday week there are 42% more sales than an average day during a non-holiday week.
- Use the filters to narrow down holiday weeks, years, and categories to track what drives the most incremental sales.
- Track average daily discounting for holiday weeks.
- Similar to incrementality, average discount is calculated as the average price for products during a holiday week relative to the average price for products during a non-holiday week.
- What is a holiday week?
- A holiday week is the 6 days leading up to a holiday and the day of the holiday.
- With the exception of Dab Day being the 5 days leading up to the holiday plus day of because it overlaps with Independence Day.
- A holiday week is the 6 days leading up to a holiday and the day of the holiday.
-
- We choose to use holiday weeks over holiday days because sales often increase around the holidays as well as dispensaries being closed on some holidays.
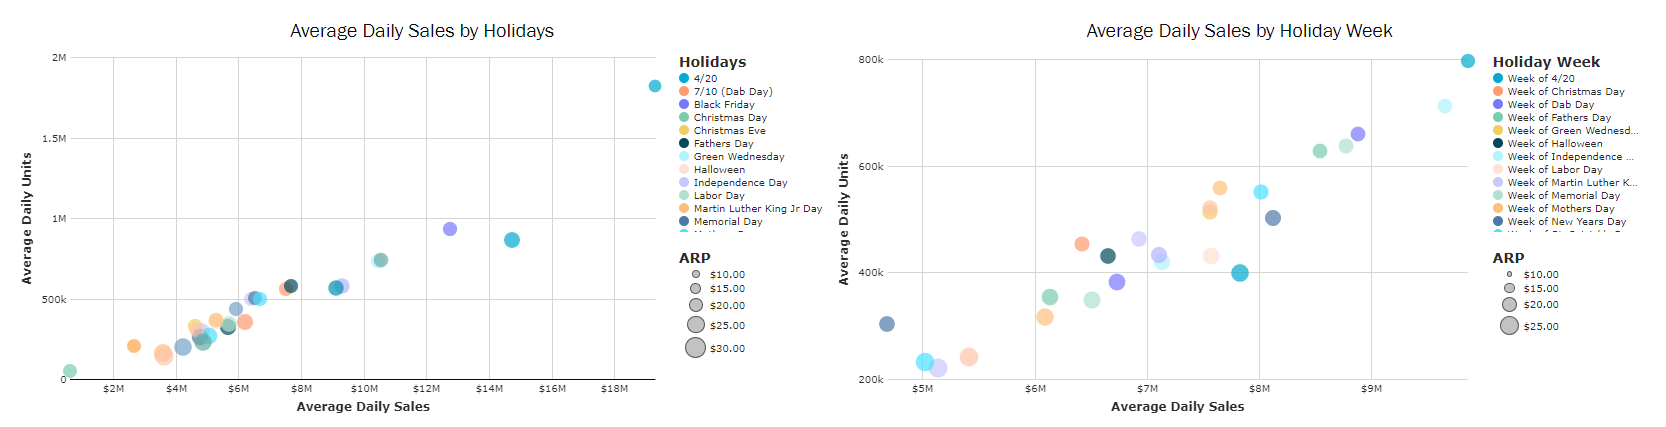
- Use the scatterplots to see the relationship between dollar and unit volume for both holiday days and holiday weeks.
- X-axis is dollar sales
- Y-Axis is unit sales
- Dots are sized by ARP
- Each year and holiday combo has its own dot, but same holidays share a color
- Use the Holiday Week filter to compare holidays year over year.
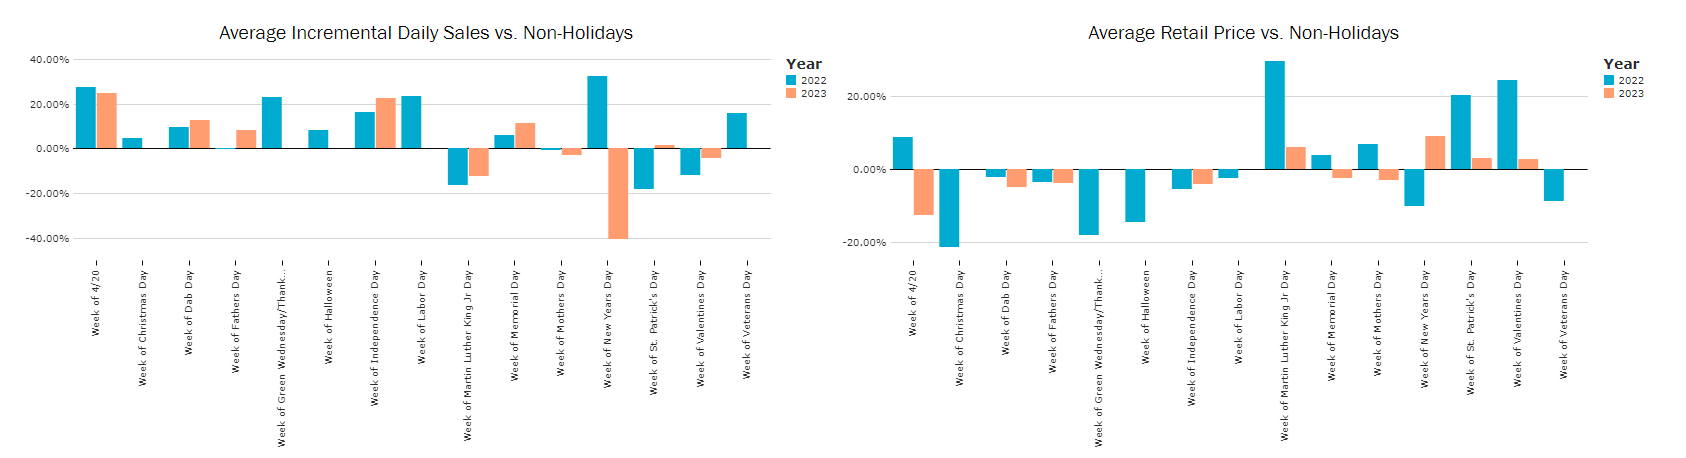
- Track by holiday week and year which holidays produce the most incremental sales, as well as the average discount across products.
- Use the category filters to drill into which products drive the most sales and plan category promotions on holidays.
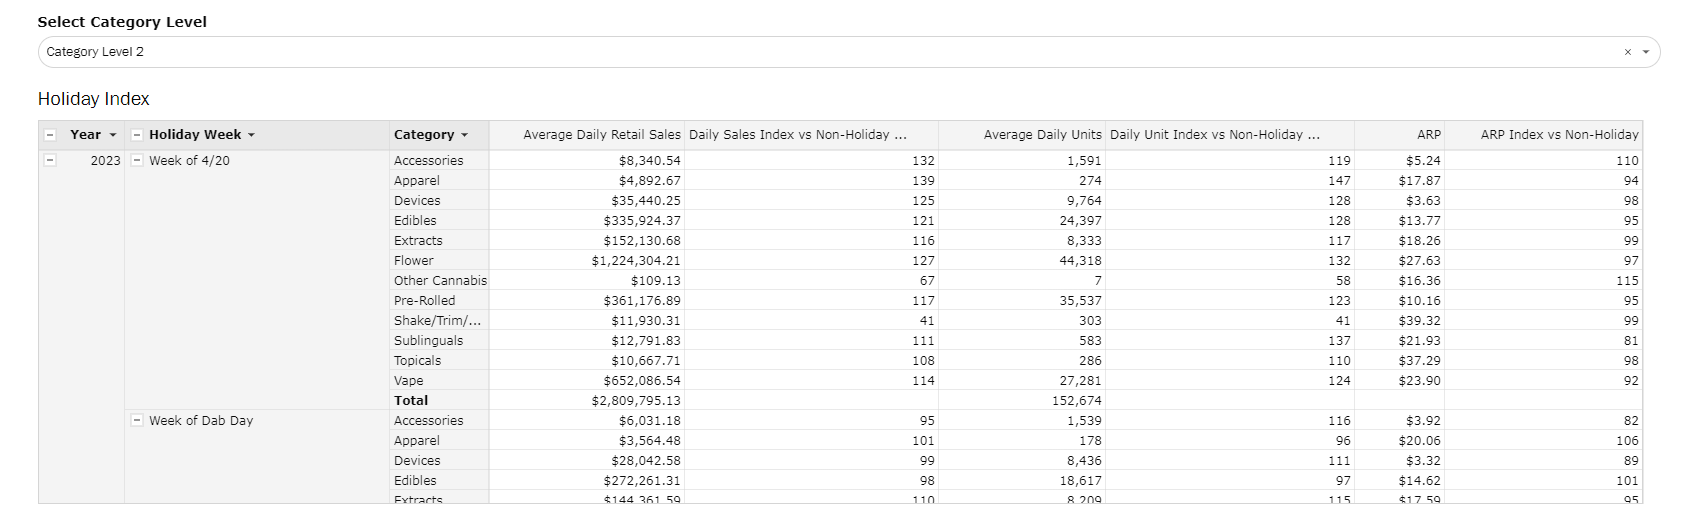
- Use the index table to track category level average daily dollar and unit sales, as well as ARP, and how they index vs non-holiday weeks